Free Splunk Hosting

Published on Thursday, November 28, 2013

I first used Splunk about 10 years ago after an old colleague installed it on a computer in the corner, and ever since then I have preached about it. If you have log data, of any kind, I'd recommend you give it a go.

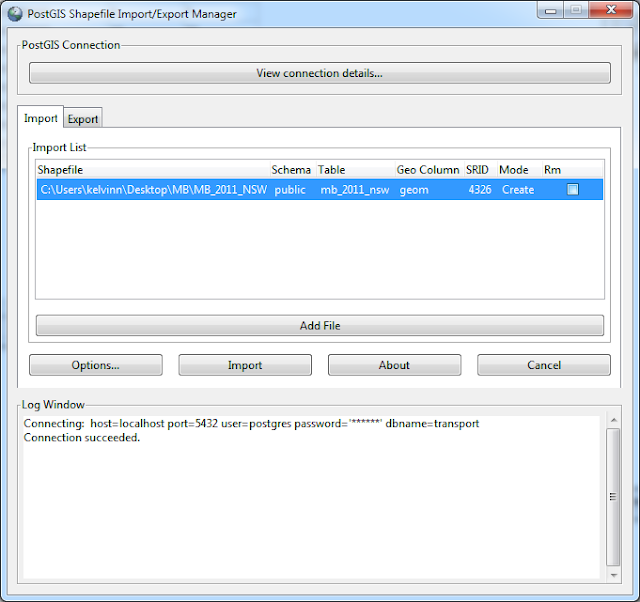
The Splunk people have a a few pretty good options for trying Splunk out, as you can either use Splunk Storm or Splunk Free. The first option is obviously hosted, and has a generous storage option, but also does not allow long term storage of data. I send system log data to Splunk Storm.

However, what if you don't have a lot of data, but you want to keep that data forever? After reading Ed Hunsinger's Go Splunk Yourself entry about using it for Quantified Self data, I knew I had to do the same.

From personal experience, Splunk requires at least 1GB to even start. You can probably get it to run on less, but I haven't had much success. This leaves two options: look at Low End Box for a VPS with enough memory (as cheap as $5/month), of use OpenShift. Red Hat generously provides three "gears" to host applications, for free, and each with 1GB of memory. I have sort of a love-hate relationship with OpenShift, maybe a bit like using OAuth. Red Hat calls OpenShift the "Open Hybrid Cloud Application Platform", and I can attest that it is really this. They have provided a method to bundle an application stack and push it into production without needing to fuss about infrastructure, or even provisioning and management of the application. It feels like what would happen if Google App Engine and Amazon's EC2 had a child. Heroku or dotCloud might be its closest alternatives.

Anyways, this isn't a review of OpenShift, although it would be a positive review, but instead on how to use OpenShift to host Splunk. I first installed Splunk in a gear using Nginx as a proxy, and it worked. However, this felt overly complex, and after one of my colleagues started working on installing Splunk in a cartridge, I eventually agreed this would be the way to go. The result was a Splunk cartridge that can be installed inside any existing gear. Here are the instructions; you need an OpenShift account, obviously. The install should take less than ten clicks of your mouse, and one copy/paste.

From the cartridge's GitHub README:

  1. Create an Application based on existing web framework. If in doubt, just pick "Do-It-Yourself 0.1" or "Python 2.7"
  2. Click on "Continue to the application overview page."
  3. On the Application page, click on "Or, see the entire list of cartridges you can add".
  4. Under "Install your own cartridge" enter the following URL: https://raw.github.com/kelvinn/openshift-splunk-cartridge/master/metadata/manifest.yml
  5. Next and Add Cartrdige. Wait a few minutes for Splunk to download and install.
  6. Logon to Splunk at: https://your-app.rhcloud.com/ui

More details can be read on the cartridge's GitHub page, and I would especially direct you to the limitations of this configuration. This will all stop working if Splunk makes the installer file unavailable, but I will deal with that when the time comes. Feel free to alert me if this happens.


Finding The Same (Misspelled) Name Using Python/NLTK

Published on Friday, September 13, 2013

I have been meaning to play around with the Natural Language Toolkit for quite some time, but I had been waiting for a time when I could experiment with it and actually create some value (as opposed to just play with it). A suitable use case appeared this week: matching strings. In particular, matching two different lists of many, many thousands of names.

To give you an example, let's say you had two lists of names, but with the name spelled incorrectly in one list:

List 1:
Leonard Hofstadter
Sheldon Cooper
Penny
Howard Wolowitz
Raj Koothrappali
Leslie Winkle
Bernadette Rostenkowski
Amy Farrah Fowler
Stuart Bloom
Alex Jensen
Barry Kripke

List 2:
Leonard Hofstadter
Sheldon Coopers
Howie Wolowits
Rav Toothrapaly
Ami Sarah Fowler
Stu Broom
Alexander Jensen

This could easily occur if somebody was manually typing in the lists, dictating names over the phone, or spell their name differently (e.g. Phil vs. Phillip) at different times.

If we wanted to match people on List 1 to List 2, how could we go about that? For a small list like this you can just look and see, but with many thousands of people, something more sophisticated would be useful. One tool could be NLTK's edit_distance function. The following Python script displays how easy this is:

import nltk

list_1 = ['Leonard Hofstadter', 'Sheldon Cooper', 'Penny', 'Howard Wolowitz', 'Raj Koothrappali', 'Leslie Winkle', 'Bernadette Rostenkowski', 'Amy Farrah Fowler', 'Stuart Bloom', 'Alex Jensen', 'Barry Kripke']

list_2 = ['Leonard Hofstadter', 'Sheldon Coopers', 'Howie Wolowits', 'Rav Toothrapaly', 'Ami Sarah Fowler', 'Stu Broom', 'Alexander Jensen']

for person_1 in list_1:
    for person_2 in list_2:
        print nltk.metrics.edit_distance(person_1, person_2), person_1, person_2

0 Leonard Hofstadter Leonard Hofstadter
15 Leonard Hofstadter Sheldon Coopers
14 Leonard Hofstadter Howie Wolowits
15 Leonard Hofstadter Rav Toothrapaly
14 Leonard Hofstadter Ami Sarah Fowler
16 Leonard Hofstadter Stu Broom
15 Leonard Hofstadter Alexander Jensen
14 Sheldon Cooper Leonard Hofstadter
1 Sheldon Cooper Sheldon Coopers
13 Sheldon Cooper Howie Wolowits
13 Sheldon Cooper Rav Toothrapaly
12 Sheldon Cooper Ami Sarah Fowler
11 Sheldon Cooper Stu Broom
12 Sheldon Cooper Alexander Jensen
16 Penny Leonard Hofstadter
13 Penny Sheldon Coopers
13 Penny Howie Wolowits
14 Penny Rav Toothrapaly
16 Penny Ami Sarah Fowler
9 Penny Stu Broom
13 Penny Alexander Jensen
11 Howard Wolowitz Leonard Hofstadter
13 Howard Wolowitz Sheldon Coopers
4 Howard Wolowitz Howie Wolowits
15 Howard Wolowitz Rav Toothrapaly
13 Howard Wolowitz Ami Sarah Fowler
13 Howard Wolowitz Stu Broom
14 Howard Wolowitz Alexander Jensen
16 Raj Koothrappali Leonard Hofstadter
14 Raj Koothrappali Sheldon Coopers
16 Raj Koothrappali Howie Wolowits
4 Raj Koothrappali Rav Toothrapaly
14 Raj Koothrappali Ami Sarah Fowler
14 Raj Koothrappali Stu Broom
16 Raj Koothrappali Alexander Jensen
14 Leslie Winkle Leonard Hofstadter
13 Leslie Winkle Sheldon Coopers
11 Leslie Winkle Howie Wolowits
14 Leslie Winkle Rav Toothrapaly
14 Leslie Winkle Ami Sarah Fowler
12 Leslie Winkle Stu Broom
12 Leslie Winkle Alexander Jensen
17 Bernadette Rostenkowski Leonard Hofstadter
18 Bernadette Rostenkowski Sheldon Coopers
18 Bernadette Rostenkowski Howie Wolowits
19 Bernadette Rostenkowski Rav Toothrapaly
20 Bernadette Rostenkowski Ami Sarah Fowler
20 Bernadette Rostenkowski Stu Broom
17 Bernadette Rostenkowski Alexander Jensen
15 Amy Farrah Fowler Leonard Hofstadter
14 Amy Farrah Fowler Sheldon Coopers
15 Amy Farrah Fowler Howie Wolowits
14 Amy Farrah Fowler Rav Toothrapaly
3 Amy Farrah Fowler Ami Sarah Fowler
14 Amy Farrah Fowler Stu Broom
13 Amy Farrah Fowler Alexander Jensen
15 Stuart Bloom Leonard Hofstadter
12 Stuart Bloom Sheldon Coopers
12 Stuart Bloom Howie Wolowits
14 Stuart Bloom Rav Toothrapaly
13 Stuart Bloom Ami Sarah Fowler
4 Stuart Bloom Stu Broom
14 Stuart Bloom Alexander Jensen
15 Alex Jensen Leonard Hofstadter
12 Alex Jensen Sheldon Coopers
13 Alex Jensen Howie Wolowits
15 Alex Jensen Rav Toothrapaly
13 Alex Jensen Ami Sarah Fowler
10 Alex Jensen Stu Broom
5 Alex Jensen Alexander Jensen
15 Barry Kripke Leonard Hofstadter
13 Barry Kripke Sheldon Coopers
13 Barry Kripke Howie Wolowits
12 Barry Kripke Rav Toothrapaly
13 Barry Kripke Ami Sarah Fowler
10 Barry Kripke Stu Broom
14 Barry Kripke Alexander Jensen

As you can see, this displays the Levenstein distance of the two sequences. Another option we have is to look at the ratio.

len1 = len(list_1)
len2 = len(list_2)
lensum = len1 + len2
for person_1 in list_1:
    for person_2 in list_2:
        levdist = nltk.metrics.edit_distance(person_1, person_2)
        nltkratio = (float(lensum) - float(levdist)) / float(lensum)
        if nltkratio > 0.70:
            print nltkratio, person_1, person_2

1.0 Leonard Hofstadter Leonard Hofstadter
0.944444444444 Sheldon Cooper Sheldon Coopers
0.777777777778 Howard Wolowitz Howie Wolowits
0.777777777778 Raj Koothrappali Rav Toothrapaly
0.833333333333 Amy Farrah Fowler Ami Sarah Fowler
0.777777777778 Stuart Bloom Stu Broom
0.722222222222 Alex Jensen Alexander Jensen

Sydney's Education Levels Mapped

Published on Sunday, September 8, 2013

I was talking to a friend about what education levels might look like across Sydney, and a friend challenged me to map it. The below map is my first draft.

The map was derived by combining three datasets from the Australian Bureau of Statistics (ABS - a department releasing some great datasets). The first dataset was the spatial data for "SA2" level boundaries, the second the population data for various geographic areas, and the third from the 2011 Census on Non-School Qualification Level of Education (e.g. Certificates, Diplomas, Masters, Doctorates). I aggregated all people with bachelors or higher in an SA2 region, and then divided that number by the total number of people in that region. A different methodology could have been used.

EDIT: I should have paid more attention to mapping education levels. I mapped the percentage of overall population, but should have mapped the percentage of 25 to 34 year olds, as this would have aligned to various government metrics.

Reported education levels differ vastly by region, e.g. "North Sydney - Lavender Bay" (40%) vs. "Bidwell - Hebersham - Emerton" (3%). It is interesting to look at the different urban density levels of the areas, as well as the commute times to the nearest centre.

Without trying to sound too elitist, I was hoping to use this map to guide me where to consider buying our next property (i.e. looking for a well educated, clean area with decent schools and frequent public transport). It was interesting to discover that the SA2 region we currently live in has the second highest percentage in NSW.

Feel free to take a look at the aggregated data yourself or download it (attribution to ABS for source datasets).


View Full Screen

Sydney Commute Times Mapped Part 2

Published on Monday, August 5, 2013

In Sydney Commute Times Mapped Part 1 I took a small step to a bigger goal of mashing together public transport in Sydney, and the Metropolitan Strategy for Sydney to 2031. The question I wanted to answer is this: how aligned is Sydney's public transport infrastructure and the Metropolitan Strategy's of a "city of cities"?

I decided to find out.

Thanks to the release of GTFS data by 131500 it is possible to visualise how long it takes via public transport to commute to the nearest "centre".

Cities and Corridors - Metropolitan Strategy for Sydney to 2031

The Australian Bureau of Statistics collects data based on "mesh blocks", or roughly an area containing roughly 50 dwellings. Last week I had some fun mapping the mesh blocks, as well as looking at Sydney's urban densities. These mesh blocks are a good size to look at for calculating commute times.

The simplified process I used was this, for the technical minded:

  1. Calculate the centre of each mesh block
  2. Calculate the commute time via public transport from each block to every "centre" (using 131500's GTFS and OpenTripPlanner's Analyst tool)
  3. Import times in a database, calculate lowest commute time to each centre
  4. Visualise in TileMill
  5. Serve tiles in TileStache and visualise with Leaflet

The first map I created was simply to indicate how long it would take to the nearest centre. There appears to be rapidly poorer accessibility on the fringe of Sydney. I was also surprised of what appears to be a belt of higher times between Wetherill Park and all the way to Marrickville. There also appears to be poorer accessibility in parts of Western Sydney. It is worth noting that I offer not guarantee of the integrity of the data in these maps, and I have seen a few spots where the commute times increase significantly in adjacent mesh blocks. This tells me the street data (from OpenStreetMap) might not be connected correctly.


View Full Screen

My next map shows what areas are within 30 minutes.


View Full Screen

These maps were both created using open data and open source tools, which I find quite neat. In that spirit, I have exported the database (probably a bit hard for most to work with) to a Shapefile. You can open this in TileMill and experiment, if you wish. Download it from here (note: 250MB zip file):

I have been interested in mapping traffic for a number of years, maybe ever since arriving in Sydney. It is sort of a hobby; I find making maps relaxing. My first little map was way back in 2008, where I visualised speed from a GPS unit. A little later I added some colour to the visualisations, and then used this as an excuse to create a little GUI for driving speed. My interest in visualising individual vehicles has decreased recently, as it has now shifted to the mapping wider systems. Have an idea you would like to see mapped? Leave a note in the comments.

Quantified Self Interview

Published on Saturday, July 27, 2013

YS and I were recently interviewed about self-tracking and Quantified Self by one of the major news channels in Australia. I will reflect on the experience after the show has aired, but it was an overall great experience. We have a new respect for filming what may ultimately be just a two minute segment. Depending on how the editing is done it will either provoke the hosts to contemplate the value of a data-centric macroscopic view of the world, or give them lots of fodder.

That said, as you would expect, I had to track my heart rate during the interview - see below. My interpretation is that my heart rate jumped at the start of every questions, and went down as I answered the question. It also dropped when the interview finished. I wish I had a more expensive heart rate monitor (e.g. Zephyr BioHarness or Scanadu) that tracked skin temperature and breathing. My hands felt cold by the end.
.

Coffee, Beer, Wine and Time of Day

Published on

One of the things I like Tableau, a piece of software to visualise data, is that it aggregates on dates really well. Below is a spread of beer / wine / coffee over 18 months, but grouped by what hour is fell in. You can see some trends, like I usually consume coffee in the morning, and that I usually drink after 17:00. There are exceptions, of course, like that beer I had at 10AM, and that coffee I had at 1AM.


Some QS Numbers

Published on Thursday, July 25, 2013

There is the possibility I will be giving an interview on the Quantified Self "movement". What follows is a brief summary of QS, the things I track, and some pretty charts.

What is Quantified Self

I suppose it depends on who you talk to. Wikipedia states that it is "a movement to incorporate technology into data acquisition on aspects of a person's daily life in terms of inputs", but I side more on the idea that the movement is "a collaboration of users and tool makers who share an interest in self knowledge through self-tracking." It is at this point that it is probably important to interject that most people are self-trackers: weight, height, reps at the gym, hours worked, and so forth. If you have ever made a goal, you probably tracked how you could reach it. What makes us QS folk a bit different is that we tend to track lots of things, correlate between them, and share our results. So, with this theme, let me share what I track.

What I Track, and How

This is a list of some of the things I track, and the tools I use to do so.

  • Weight / Body Fat / Temperature / Measurements -> scales, callipers, ear thermometer
  • Resting Heart Rate -> oximeter
  • Drinks (wine, beer, coffee – and previously water) -> Android app (bespoke)
  • Drugs and vitamins -> Android app (bespoke)
  • Various conditions (headaches, “colds”, itchiness, nausea, sore throats, “the runs”) -> Android app (bespoke)
  • Finances (family) -> Android app (TOSHL)
  • Start/Stop times of work -> Excel…
  • Mood (Terrible to Great) -> Android app (How Are You Feeling)
  • Indoor air quality (not really QS) -> various sensors
  • Computer activity (Keystrokes / mouse clicks / mouse movement) -> WorkRave
  • Location -> Google Latitude
  • Steps & sleep -> Fitbit
  • Fitness --> Android app (Sports Tracker) and a Zephyr Bluetooth Heart Rate Monitor
  • Health History -> Microsoft HealthVault
  • Photo every day -> Android app (PhotoChron)
You can see that this list seems utterly normal, but still gives me enough to work with to start forming a macroscopic view of life.

A Few Charts

I created these using Tableau, a fabulous piece of software for putting meaning behind numbers. These are not good examples of what the software is capable of, but it is the quickest way for me to visualise them.

I like coffee. It is, in all honesty, a drug. There have been times (I could probably find the date!) when I went from two cups a day to none, and I had withdrawals (headaches and nausea). I track the amount of coffee I consume to remind myself to not get into the habit of having two cups/day for too long. It is also bad for my stomach.

If I chart the days of the week I like to drink coffee over the last 18 months, it turns out I drink the most amount of coffee on Saturday


 I also enjoy an alcoholic drink from time to time, but was told in January to cut back (for my stomach's sake).


I track both beer and wine consumption. I have managed to cut back on wine, but not so much on beer.


This can be explained because I tend to have beer when I go out with work colleagues or friends, but wine at home. It appears to have been easier to stop drinking with dinner than when out.

For the last two years I have been wearing a FitBit, usually, and using it to "track" my sleep.


It looks like I averaged about 7500 steps/day, yet started walking more in January of this year. Walking more was not a New Year's Resolution. In May I broke the clip to my FitBit, but a friend was kind enough to give me their's as a replacement. I should walk more.

I should also sleep more. It appears as though maybe, just maybe, I am starting to sleep more. My average is about 7.5hr/night. This is one area I would like to experiment more with.


I have also started tracking happiness on a simple Terrible -> Great! scale.

This graph shows my average happiness on a weekly basis for the last ~8 months. We could conclude that I'm getting more happy, and was really unhappy around Christmas.


And here we have my happiness levels when grouped by day of the week. We could conclude that I am, on average, the most content on a Sunday. I would like to believe it is just a coincidence that I am most content on a Sunday, and drink the least amount of coffee.


This is the standard deviation of my happiness tracking on a monthly basis. It looks like I am also getting less moody.


And finally, weight. Nothing interesting here. I need to get back down to 77KG, which is a more natural weight for me. I use a normal scale so only record every few months - if I had a wi-fi scale, I would be able to record much more frequently. 


Final Thoughts

In the last ~18 months I have become more happy and less moody, with Sunday being my happiest day, and Monday and Wednesday being my least content. I have put on three KG. I drink the most amount of coffee on Saturday, the least amount on Sunday, and have been able to drink less wine, but keep drinking the same amount of beer.

By looking at this evaluation I know I should probably start to incorporate a lunchtime walk into my daily routine, and stop drinking coffee on one day of the weekend. I should also drink my beer at a slower pace when I'm out, as this will prevent me from buying more than one, or, even harder to resist, friends and colleagues buying it for me.

Finally: I know none of the charts have a title. Read the text.

Sydney Commute Times Mapped Part 1

Published on Sunday, July 21, 2013

I quite like open data. I like data based on open standards (or mostly open standards) even better. Many transport operators around the world have started releasing their timetable data using (mostly) open standards, e.g. GTFS. One of the nice things about using a standard is that clever people have created tools to work with the timetable data, and those tools can now be used to manipulate timetable data from hundreds of agencies. The magnificent OpenTripPlanner is one such tool, and it works well with 131500's GTFS data.

New South Wales Planning & Infrastructure have released a draft plan for how they hope to shape Sydney's growth, which is where they detail the idea of a "city of cities". I thought it would be interesting to mash these smaller "cities" with 131500's transport data, and then display a map with the shortest commute to the nearest city. Various cities, I believe including Melbourne, have goals of re-achieving a "20-minute" city, or something similar (i.e. X% of the population can reach X% of the city within X minutes).

This map is the first stage. It only displays the commute time to St Leonards from every Mesh Block in the greater Sydney area. I used the open source tool OpenTripPlanner to computer the commute times, with OpenStreetMaps to support walking distances. The next map I release will probably have all the regional cities, and a similar styled map depicting time to nearest "centre".


Mapping Mesh Blocks with TileMill

Published on Saturday, July 20, 2013

This quick tutorial will detail how to prepair the ABS Mesh Blocks to be used with MapBox's TileMill. Beyond scope is how to install postgresql, postgis and TileMill. There is a lot of documentation how to do these tasks.

First, we create a database to import the shapefile and population data into:


Using 'psql' or 'SQL Query', create a new database:

CREATE DATABASE transport WITH TEMPLATE postgis20 OWNER postgres;
# Query returned successfully with no result in 5527 ms.

It is necessary to first import the Mesh Block spatial file using something like PostGIS Loader.


We then create a table to import the Mesh Block population data:

CREATE TABLE tmp_x (id character varying(11), Dwellings numeric, Persons_Usually_Resident numeric);

And then load the data:

COPY tmp_x FROM '/home/kelvinn/censuscounts_mb_2011_aust_good.csv' DELIMITERS ',' CSV HEADER;

It is possible to import the GIS information and view it in QGIS:


Now that we know the shapefile was imported correctly we can merge the population with spatial data. The following query is used to merge the datasets:

UPDATE mb_2011_nsw
SET    dwellings = tmp_x.dwellings FROM tmp_x
WHERE  mb_2011_nsw.mb_code11 = tmp_x.id;

UPDATE mb_2011_nsw
SET    pop = tmp_x.persons_usually_resident FROM tmp_x
WHERE  mb_2011_nsw.mb_code11 = tmp_x.id;

We can do a rough validation by using this query:

SELECT sum(pop) FROM mb_2011_nsw;

And we get 6916971, which is about right (ABS has the 2011 official NSW population of 7.21 million).

Finally, using TileMill, we can connect to the PostgGIS database and apply some themes to the map.

host=127.0.0.1 user=MyUsername password=MyPassword dbname=transport
(SELECT * from mb_2011_nsw JOIN westmead_health on mb_2011_nsw.mb_code11 = westmead_health.label) as mb


After generating the MBTiles file I pushed it to my little $15/year VPS and used TileStache to serve the tiles and UTFGrids. The TileStache configuration I am using looks something like this:

{
  "cache": {
    "class": "TileStache.Goodies.Caches.LimitedDisk.Cache",
    "kwargs": {
        "path": "/tmp/limited-cache",
        "limit": 16777216
    }
  },
  "layers": 
  {
    "NSWUrbanDensity":
    {
        "provider": {
            "name": "mbtiles",
            "tileset": "/home/user/mbtiles/NSWUrbanDensity.mbtiles"
        }
    },
    "NSWPopDensity":
    {
        "provider": {
            "name": "mbtiles",
            "tileset": "/home/user/mbtiles/NSWPopDensity.mbtiles"
        }
    }
  }
}

Mapping Urban Density in Sydney

Published on

Five years ago I started exploring different mapping technologies by detailing instructions on installing Mapnik and mod_tile. Times have changed significantly in the last five years, and thanks a lot to the products offered by MapBox. After playing with TileMill, MBTiles, Leaflet and UTFGrids, it is great how many annoyances have been fixed by MapBox. I find it enjoyable making maps now, as I no longer need to worry about patching code just to get it to run, or mucking about with oddities in web browser.

Each night this week I have created a new map using Mesh Block spatial data from the Australian Bureau of Statistics (Mesh Blocks are the smallest area used when conducting surveys). I am thankful to live in a country that provides a certain amount of open data, and the ABS should be applauded for the amount of data they provide. They provide spatial data about Mesh Blocks, as well as population counts for this spatial data. It is relatively easy to merge the two and then visualise them using TileMill.

First up - population density of Sydney, i.e. persons reported to be living in each mesh block. Darker red indicates a higher population count.


View Full Screen

I find it interesting to see how many people live in certain Mesh Blocks. You will notice that Mesh Blocks with high population levels tend to be nearer public transport - either major roads with frequent bus service, or train stations.

We can look at the urban densities by determining dwellings per hectare, and do this per Mesh Block. The definition I used for urban densities comes from Ann Forsyth in "Measuring Density: Working Definitions for Residential Density and Building Intensity" (pdf). Ann discusses the need to consider net or gross densities, depending on the type of land use. At the Mesh Block level the land use type appears to be singular: Industrial, Parkland, Commercial, Residential, and Transport. Because the land use type was generally singular I have not adjusted to gross/net, but still used Ann's definitions of certain density bands:
  • Very low density: 11 dw/ha
  • Low density: 11-22 dw/ha
  • Medium density: 23-45 dw/ha
  • High density: 45 dw/ha
"dw/ha" is dwellings per hectare. I decided to map the four density levels, which can be relatively easily achieved using TileMill. See below for an example.


View Full Screen

You can zoom in and scroll over any Mesh Block in Sydney to find out more. Additional installation information on how I did this can be found on this special page: Mapping Mesh Block Data.


Hiking the W Circuit (Torres del Paine)

Published on Saturday, June 29, 2013

We have just returned from hiking the "W", a famous circuit through the Torres del Paine, in Patagonia. Although we did some research before doing the trek, it turns out we made a number of assumptions that turned out to be incorrect. I will detail in this entry what we learned, a few things that worked well, and a few things that did not work so well.

I will try to avoid posting spoilers of the major sites, and instead focus on logistics of doing the trek. First things first: much of this content is from what we learned at a talk given at the Erratic Rock hostel, at 3PM the day before entering the park. The single biggest suggestion I would give you is to go to this talk.

Next, I should clear the two biggest assumptions I had before arriving, so you can plan accordingly.

1) "Pirate" camping is frowned upon - probably even illegal in the park. You must stay at a designated camp-site.
2) You can only cook at designated areas, which means you need to plan lunch meals that do not need to be cooked.
3) Water from streams is apparently safe to drink. Nobody uses filters. Just fill up at a place with flowing water, which comes straight from glaciers, and not where there is a horse crossing.
4) There are paid refugios and free refugios.
5) The paid refugios (shelters) have showers.
6) The transportation to and from the park is timed perfectly for all the trekkers, but it is crucial you plan for what bus you want to take.
7)  It gets really cold at night, at least it did in March. If you bring your own sleeping bag, then make sure it is rated at least down to -5C, maybe -10C, otherwise you won't be getting much sleep.

How do you get to the Torres del Paine?

This naturally depends where you are coming from. We were in Santiago, so flew to Punta Arenas and took a bus to Puerto Nateles. One thing that was a little unclear was if the bus would stop at the airport in Punta Arenas or not. We decided not to risk it, so caught a mini-bus from the airport to the bus terminal (3000CLP), and caught a bus to Puerto Nateles almost immediately. It turns out the bus did stop at the airport and picked on person up - there were no other seats left. I would suggest you email or call the bus company (Bus Ferdnandez) and make sure they pick you up.

One of the first decisions you will need to make is if you should camp, or just stay in a refugio? It was obvious the people who were staying in refugios, as their packs were usually quite small, and they smelled really clean. It was obvious the people doing the full trek, as they usually looked tired, and not terribly clean. We were in the later group. Base Camp, right next to Erratic Rock, where the 3PM talk is held, offers gear rental. The prices are reasonable. Equipment needs to be reserved before you arrive during high season.

What are these refugios? Do they need to be booked in advance? The refugios are little shelters at different camp-sites strewn throughout the park. We camped, but I believe there are nice shelters (more similar to cabins), and some that are more like dormitories. Take note that you must camp at one of these designated campsites, and they aren't all free - more details below in the day-to-day breakdown. The two companies running the refugios are: Fantasticosur and Vertice. I think you should book in advance, but maybe research this. 

What route to take? The route you take will depend strictly on how far you want to trek each day, or are capable, as you must stay at a camp-site. At the Erratic Rock talk they will give you a suggested route, from west to east, which is one we and a group of others followed. A map of the hiking area will be provided at check in.

I brought my GPS logger with me on the trip, as I do on all my trips, so was able to make a record of where we walked. See below for the map, or you can download the KML file.


The "Erratic Rock Route" goes like this:

Day 1

Catch 7:30 bus into Torres del Paine - your hostel/hotel can surely organise. Our bus cost 15000CLP return. You will enter park at about 10:00 and pay the park entrance fee. The fee is 18000CLP. You will also listen to a short talk telling you not to "pirate" camp, and don't burn down the forest. The bus will wait for you. Continue taking the bus to the second stop, which is right next to Lago Pehoe. Disembark the bus and walk to the catamaran. The boat goes between this second stop and refugio Paine Grande. The boat costs 8000CLP.

You will arrive Paine Grande at about 13:00 and need to start hiking immediately. This day you will hike 11KM to Refugio Grey where you will set-up tent and put down your bags. The stay is 4000CLP. After setting down your bags you will keep going along the trail to the Mirador overlooking the glacier - this hike is about 4KM. Arrive as early as possible, as the sun will set behind the glacier and taking photos will become difficult.

Day 2

Wake up rather early, cook breakfast, and hike from Refugio Grey back to Refugio Paine Grande (11KM, ~3.5hr). Have a quick lunch, and continue hiking to Campamento Italiano (7.6KM, ~2.5hr). This is a free camp-site, so set-up tent, cook dinner, and get ready for bed. There is a water sprout near the top of the camp, so you don't need to walk to the river for water.

Day 3

Wake up and hike the French Valley (7.5KM each way,  ~3hr each way). Return to camp, collect your gear, and walk to Los Cuernos (5.5KM, ~1.5hr). This stay is 8000CLP, but the showers were really hot. The camp-site fills up pretty early, as people are coming from both directions, so try to arrive earlier rather than later.

Day 4

Hike from Los Cuernos to Campamento Torres. About 9KM out of Los Cuernos you will encounter a big sign that says "SHORTCUT" - take it. This will take you around the backside of one mountain, by a lake, and cut some time off an already pretty long day. It is maybe 3.5hr from the shortcut to Campamento Torres, but it is all uphill. The trail gets very well used after merging with the trail from Los Torres hotel. Campamento Torres is a free camp-site. Consider camping uphill from the bathroom.

Day 5

Wake up quit early and depart for the Base de las Torres for sunrise. Most people leave Campamento Torres by about 6:15am, but when we went it was overcast, and the sun didn't actually hit the mountain until almost 7:50. The walk takes about 45 minutes. Take your photos, hike back down to camp, pack up, and get back to Hotel Los Torres by 14:00. We ate breakfast at sunrise at the Base de las Torres (trail mix), but had a hot lunch at Campamento Chileno. A mini bus will pick you up by Hotel Los Torres at 14:00 and take you back to Laguna Amarga. This mini bus costs 2500CLP. Your bus will depart back to Puerto Natales at 14:30. Please shower and do laundry as soon as you get back - you probably smell like you're homeless.

So, what are some things that worked really well for us?

One of the best things we did was keep our packs light. Our packs were both under 10KG, including five days food, sleeping bags, pads, and tent. My pack was probably about 7KG. Probably the biggest regret we heard on the trail was that everyone's pack was too heavy. I would say most were above 20KG, even for females. A lot of this was due to the food choices made. I read a book on ultralight hiking in university, so knew some basic rules for keeping pack weight down:
  1. Don't buy food in tin cans or water (e.g. tuna)
  2. Don't bring fresh fruits or vegetables
  3. Bring plastic or titanium/aluminum cutlery
  4. Don't bring "it" if you won't have to use "it" every day
  5. No knives or leatherman (you don't have tins to open now...)
  6. 1x pants, 2x shirts, 2x socks, 2x underwear (or none), 1x long sleeve, 1x fleece, 1x down vest (maybe if cold), and 1x windbreaker/raincoat. That's it. You don't need three jumpers or five pairs of underwear. You probably don't even need the shirts as a base.
  7. Put duct tape on random things (e.g. trekking poles) instead of bringing a roll of duct tape.
  8. Buy food that cooks quickly, not types of pasta that take 20 minutes. Risotto is pretty efficient (boil, heat it some, take off flame and cover), as are some thing types of pasta in soup.
  9. You can eat out of the bowls you are cooking in - you don't need pots and plates.
  10. Bottles for only enough for 5 days. A full tube of toothpaste, big bottle of shampoo, and tube of sun screen all ads up the weight. The same is true for pills - you don't need a full pack of multivitamins, five will do.
We heard stories of people cooking pancakes and french fries somehow, which would taste amazing, but I would rather eat risotto and have a pack 1/3 the weight. We both made it through with not a single blister, whereas the person next to us right now has seven.

Other suggestions of things that  worked well for us include:

  1. Wool or wool blends of everything. It dries fast, keeps you warm, and doesn't keep odour. Get some wool blend underwear for travelling if you don't already have some.
  2. Bring a super light day pack (like one of these) that you can toss water and food into for hikes that don't require the full pack. If your full pack is comfortable enough, then just use that.
  3. Polarized UV protection glasses are a must, as is a hat. There were some seriously sun burned people returning from the trip, despite putting on "two layers of sunscreen". Wear a hat.
  4. I brought my MSR "dragonfly" stove with me, and the normal cup to cook with. Erratic Rock / Base Camp have a container with half empty gas canisters. If you don't mind risking running out of gas, grab one from here. Otherwise gas is about 8 bucks.
  5. Find additional people to share food with. Oatmeal is only sold by 1KG packages, which is a lot. Most people were throwing away leftover oatmeal at the end of the trip.
However, there were a few things that did not work that well, or not work as well as expected. The worst thing was a growing pain in my right knee. I've always had some pain in my knee after hiking, but by day two I was starting to have severe pain. The trails have quite steep ascends/descends. This destroyed my knee. On day four another walker who knew about my knee passed by and said "I have some trekking poles - I tried them, tripped over myself, and haven't used them since. Wanna try?" I had never used poles before, thinking they were only for old people with bad knees... Needless to say, I'll be buying a pair when I get back to Sydney, and I finished the day 4 hike without any pain. If you ever, even once, have had pain in your knees, then rent trekking poles. We had to skip the French Valley because my knees were hurting too much (I guess technically we hiked the "U", not the "W"). If my pack was not so light, I do not think I would have been able to go up to the Torres.

The second mistake I made was not bringing a flashlight. My logic was we would just go to bed when it got dark, and rise when it got light. This is what I have always done before when trekking. Unfortunately, this does not work that well when you want to be up before the sun rises, e.g. to see the Base de las Torres. We followed (closely) some people with torches, so made it, but came close to tripping quite a few times, and it generally wasn't that enjoyable. Most people had those LED lights that go on your forehead - that would be advisable.

Finally, I brought a Platypus for water. Hiking back in Oregon there would be some stretches with no water - maybe 4-5 hours of hiking without easy access to water. In the Torres del Paine, there was water nearly every two kilometers, so a Nalgene would have worked well. My better half just used her Nalgene, and it worked fine. It is also easier to fill up, and has measuring lines for how much water is needed for risotto.

That's all the advice and information I can give about hiking the "W" in the Torres del Paine. The hike is a bit more expensive than I had expected, but there was some great camaraderie with other hikers, and it leaves you with a feeling of accomplishment when finished.

There are a few more sites that detail this trek, including:
How to hike the "W" in Torres del Paine
THE Definitive Guide to Hiking Torres del Paine

February Sydney Python Presentation

Published on Friday, February 22, 2013

In February I gave a presentation to about 80 people at the Sydney Python group hosted by Atlassian. Firstly, Atlassian's office was beautiful, feeling a little like Google's Sydney office, but with beer on tap instead of cereal dispensers. Secondly, the talk before me on Cython by Aaron Defazio was exceptionally interesting, garnering lots of questions from the audience. My presentation, more of a show and tell on piping location data to Google's Latitude through App Engine, was also meant to subtly share my views on the need for innovation in the public sector (all sectors, really).

My slides are below. I used very little text in the slides, but you can probably catch what is going on. The response from the audience was favourable, and I thank Dylan Jay for giving me the opportunity to speak.


Lessons Learned from Kathmandu

Published on Monday, January 14, 2013

Our first trip to Kathmandu is now over, so there are some lessons learned I should scribe. Some of these are obvious, and which we abide by whenever travelling, and some we simply forgot in our (very) impromptu trip to Nepal.

1) When agreeing on a price, make 100% sure the other person states the price back to you. I thought a price had been agreed to when the other person responded "ok ok, you are a lucky man", but this does not count. As they say, reconfirm, reconfirm, reconfirm.

2) When arriving at the airport, make sure you have small bills, too. We had 3x 100RS, 1x 10RS, and then a few 500RS. The price we negotiated was 440RS, and it would have been nice to have paid the exact amount.

3) Kathmandu is polluted and dirty. I cannot emphasise this enough. It is dirtier than probably any other city we have been to. If we come back, we will be bringing masks. I know this sounds silly, to wear a mask, but any local on a motorbike or in a taxi wears a mask, and many just walking around. Instead of the normal cloth masks that many people use, I would probably bring a make with finer grained material (maybe not N95 quality), and something with activated carbon. I'd probably get a mask like one of these. We ultimately tried to avoid walking on main roads, but having some activated carbon absorb something would have made it a little less unpleasant.

4) My traveling companion's tip: bring dirty cloths, and throw them away after the trip. Or just bring black. Her beautiful blue jacket is now pretty filthy, with grease covering parts of it.

5) Bring some toilet paper. Similar to other parts of Asia, the bathrooms don't have any.

6) Bring a flashlight. The load shedding makes the city dark, and if you go out, you will want a flashlight. There aren't any lights. We only used it a few times, but I am really glad we brought two flashlights with us.

7) Bring vitamin C and lots of hand sanitizer. We did, like we always do when we travel, and I'm really glad we did. Everybody is coughing or sick, and everybody spits. It is similar to the situation in China, i.e. everyone spits. Then everybody gets sick. Bring hand sanitizer.

8) If you take a bus somewhere, try to ask when you buy tickets to sit on the left side in the middle. The front is a no-go for me. We typically had seats in the rear right, but on the curvy roads I think the left middle would be safer, as oncoming buses won't hit you. One bus on the way back had the left side decimated. If you do a search on "nepal bus crashes" in images.google.com, you will quickly see why you don't want to be in the front row.

9) Our hotel rooms all typically had just one power outlet. If you bring multiple electronic devices, bring some way to  charge more than one at a time. Something like like this travel charger would work well.

10) Bring clothing to stay warm at night. We travelled to Nepal in winter, and all our rooms got pretty cold at  night.

Enjoy!

Migrate Custom Blog to Blogger

Published on Thursday, January 10, 2013

For the last ten years I have run this website from various systems. First it was on Wordpress, then Mambo, then Joomla, and since early 2006 it has been running on custom code written using Django. I used this site as a learning tool for Django, re-wrote it after gaining more knowledge of Django, and then re-wrote it again when Google released App Engine. However, I recently realised that for the last few years I have spent more time writing little features than actually writing. I have entire trips that I never wrote because I was too busy writing code.

This week it all changed. I did the unthinkable. I moved this website to Blogger.

After evaluating some of the features of blogger, i.e. custom domains, location storing, ability to filter on labels, custom HTML/CSS, great integration with Picasa, and their mobile app, I realised I could virtually replace everything I had previously custom made.

This post gives a technical description how to migrate a site running Django, but readily applies to any blog running on custom code. I initially spent a fair bit of time trying to figure out how to convert my existing RSS feed into something Blogger could accept, but every solution required troubleshooting. I soon remembered why I love Django so much, and that it would be trivial to generate the correct XML for import.

1) Create Blogger Template
I wanted to keep my design, so I hacked it to support Blogger. Take one of the existing templates, edit the HTML, and adjust it for your design. If you've worked with templates before this shouldn't be too difficult.

2) Generate Sample XML
The first step was to generate a sample XML file from Blogger to see what would be needed for import. Create a sample post with a unique name and a few labels, and location. In Blogger, go to Settings->Other and click Export Blog. The first 90% of the file will be for your template and other settings, but eventually you will find a section with <entry> elements in it. Copy this sample element out - this will become your template.

3) Format Template
Using the sample section from the blog export, format it so the view you will create populates it correctly. A note of caution: the template needs time in ISO 8601 format, you need the <id> element, and the location element needs coordinates if there is a name. It won't import later if there is a name with no coordinates. My template looks like this:

feeds/rss.html

{%  load blog_extras %}
{% for entry in entries %}
    
        tag:blogger.com,1999:blog-1700991654357243752.post-{% generate_id %}
        {{ entry.publish_date|date:"Y-m-d" }}T10:30:00.000123
        {{ entry.publish_date|date:"Y-m-d" }}T10:30:00.000123
        
        {% for tag in entry.tags %}
            
        {% endfor %}

        {{ entry.title }}
        {{ entry.content }}


        Joe Bloggs
            https://plus.google.com/12345689843655881853
            kelvin@example.com


{% endfor %}

This isn't really RSS, so if you are pedantic you can name it something else. You will notice I loaded some template tags in there ("blog_extras"). This is for generating the random number, as this is needed for the ID element.. Here's the template tag.

blog_extras.py

# 'import random' at beginning of file
def generate_id():
    id = ""
    for x in xrange(1, 7):
        id = id + str(int(random.uniform(400, 900)))
    id = id + "8"
    return {'obj': id}
register.inclusion_tag('blog/generate_id.html')(generate_id)

/blog/generate_id.html

{{ obj }}

4) Create Code To Populate View
This section should be easy if you have written your blog in Django. Simply populate the template, what I have shown as "rss.html" above

blog/views.py

def show_rss(self):
    q = Entry.all()
    q = q.filter("genre !=", "blog")
    entries = q.fetch(500)
    return render_to_response("feeds/rss.html", {
        'entries': entries,
        }, mimetype='text/plain')

I did a filter on the model to not include "blog" entries - these are my travel stories, and I exported them separately. Remember that this is all happening on App Engine, so you will need to adjust if using Django's normal ORM.

5) Download Entries
Visit the URL you mapped to the "show_rss" function in urls.py, it should generate your list of entries. Copy and paste those entries into the exported XML from Blogger where you took out the original <entry> element.

6) Import Entries
Now go to Blogger and import your blog. With any luck you will have imported all your entries. You will probably need to do this a few times as you tweak the text. I had to remove some newlines from my original posts.

Optional Steps

7) Create Redirect URLS
Links in Blogger appear to only end in .html, which is a problem for links coming from Django. Luckily, Blogger includes the ability to add redirects. Go to Settings->Other-Search Preferences. You can then edit redirects there. I generated a list of my old URLs and combined that with a list of the new URLs. Hint: you can use Yahoo Pipes to extract a list of URLS from a RSS feed. If you open any of the links in Excel and split on forward slashes, remember that it will cut off leading zeros. Set that field to TEXT during import.

I decided not to create redirects for every entry, as I didn't really have time, and it only probably matters if somebody links directly to that page. I opened Google Analytics and looked at the Search Engine Optimisation page and sorted it by the most used inbound links. After getting down to entries that only had 1 inbound request per month I stopped creating redirects.

8) Host Stylesheets and Images Externally
Blogger won't host host files, so you need to work around this problem. All my images are generally from Picasa, except very specific website related ones. I moved those to Amazon's S3 and updated the links. I did the same with my CSS. You could probably store them in Google Storage, too.

9) Create Filters on Labels
If you had any previous groupings you can still link to them using label searches (in my case I actually added the "genre" as a label). The syntax is "/search/label/labelname/", as you can see in my howtos section link.

10) Update Webmaster Tools
If your site is part of Google's Webmaster Tools, you will want to login and take a look that things are OK. You will also probably want to update your sitemap (send Google your atom.xml feed).