Coffee, Beer, Wine and Time of Day
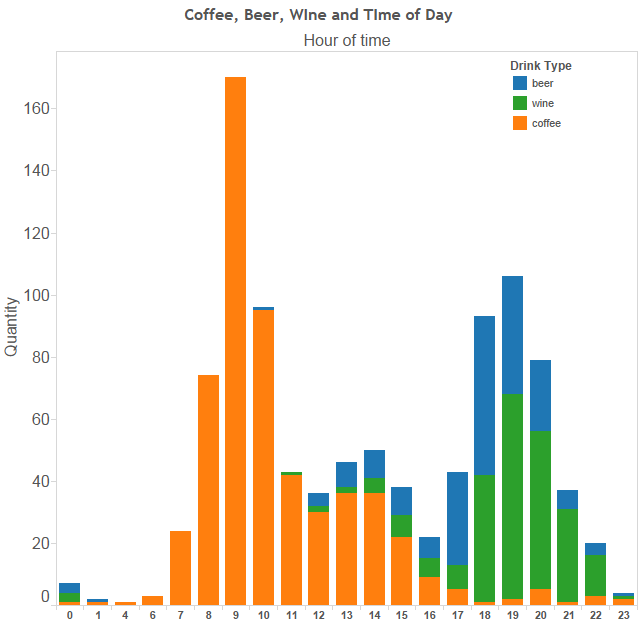
One of the things I like Tableau, a piece of software to visualise data, is that it aggregates on dates really well. Below is a spread of beer / wine / coffee over 18 months, but grouped by what hour is fell in. You can see some trends, like I usually consume coffee in the morning, and that I usually drink after 17:00. There are exceptions, of course, like that beer I had at 10AM, and that coffee I had at 1AM.
