2026 Q3 Health Review
Reflection
Q3 2026 was my strongest quarter of 2026: stress fell again, body battery climbed, steps and intensity minutes both rose, and VO2 max finished the quarter at 49.
It still was not a clean sweep. Weekly intensity averaged 698 minutes against the 800 target, sleep only just reached 80, and resting heart rate was flat until September. But the shape of the quarter is what I was hoping for after Q2: a soft July, a steadier August, and a strong September where almost every metric moved the right way at once.
Focus Areas
As usual, there are five areas that I wanted to focus on:
- Improve fitness by making ordinary weeks repeatable and pushing weekly load back towards 800 intensity minutes.
- Sleep better by improving sleep hygiene and meal timing.
- Reduce stress by reinforcing daily recovery habits.
- Improve biomarkers by focusing on measurable lab outcomes.
- Improve nutrition by using food choices to support glucose, recovery, and biomarkers.
Overall quarter snapshot:
Quarter-over-quarter highlights:
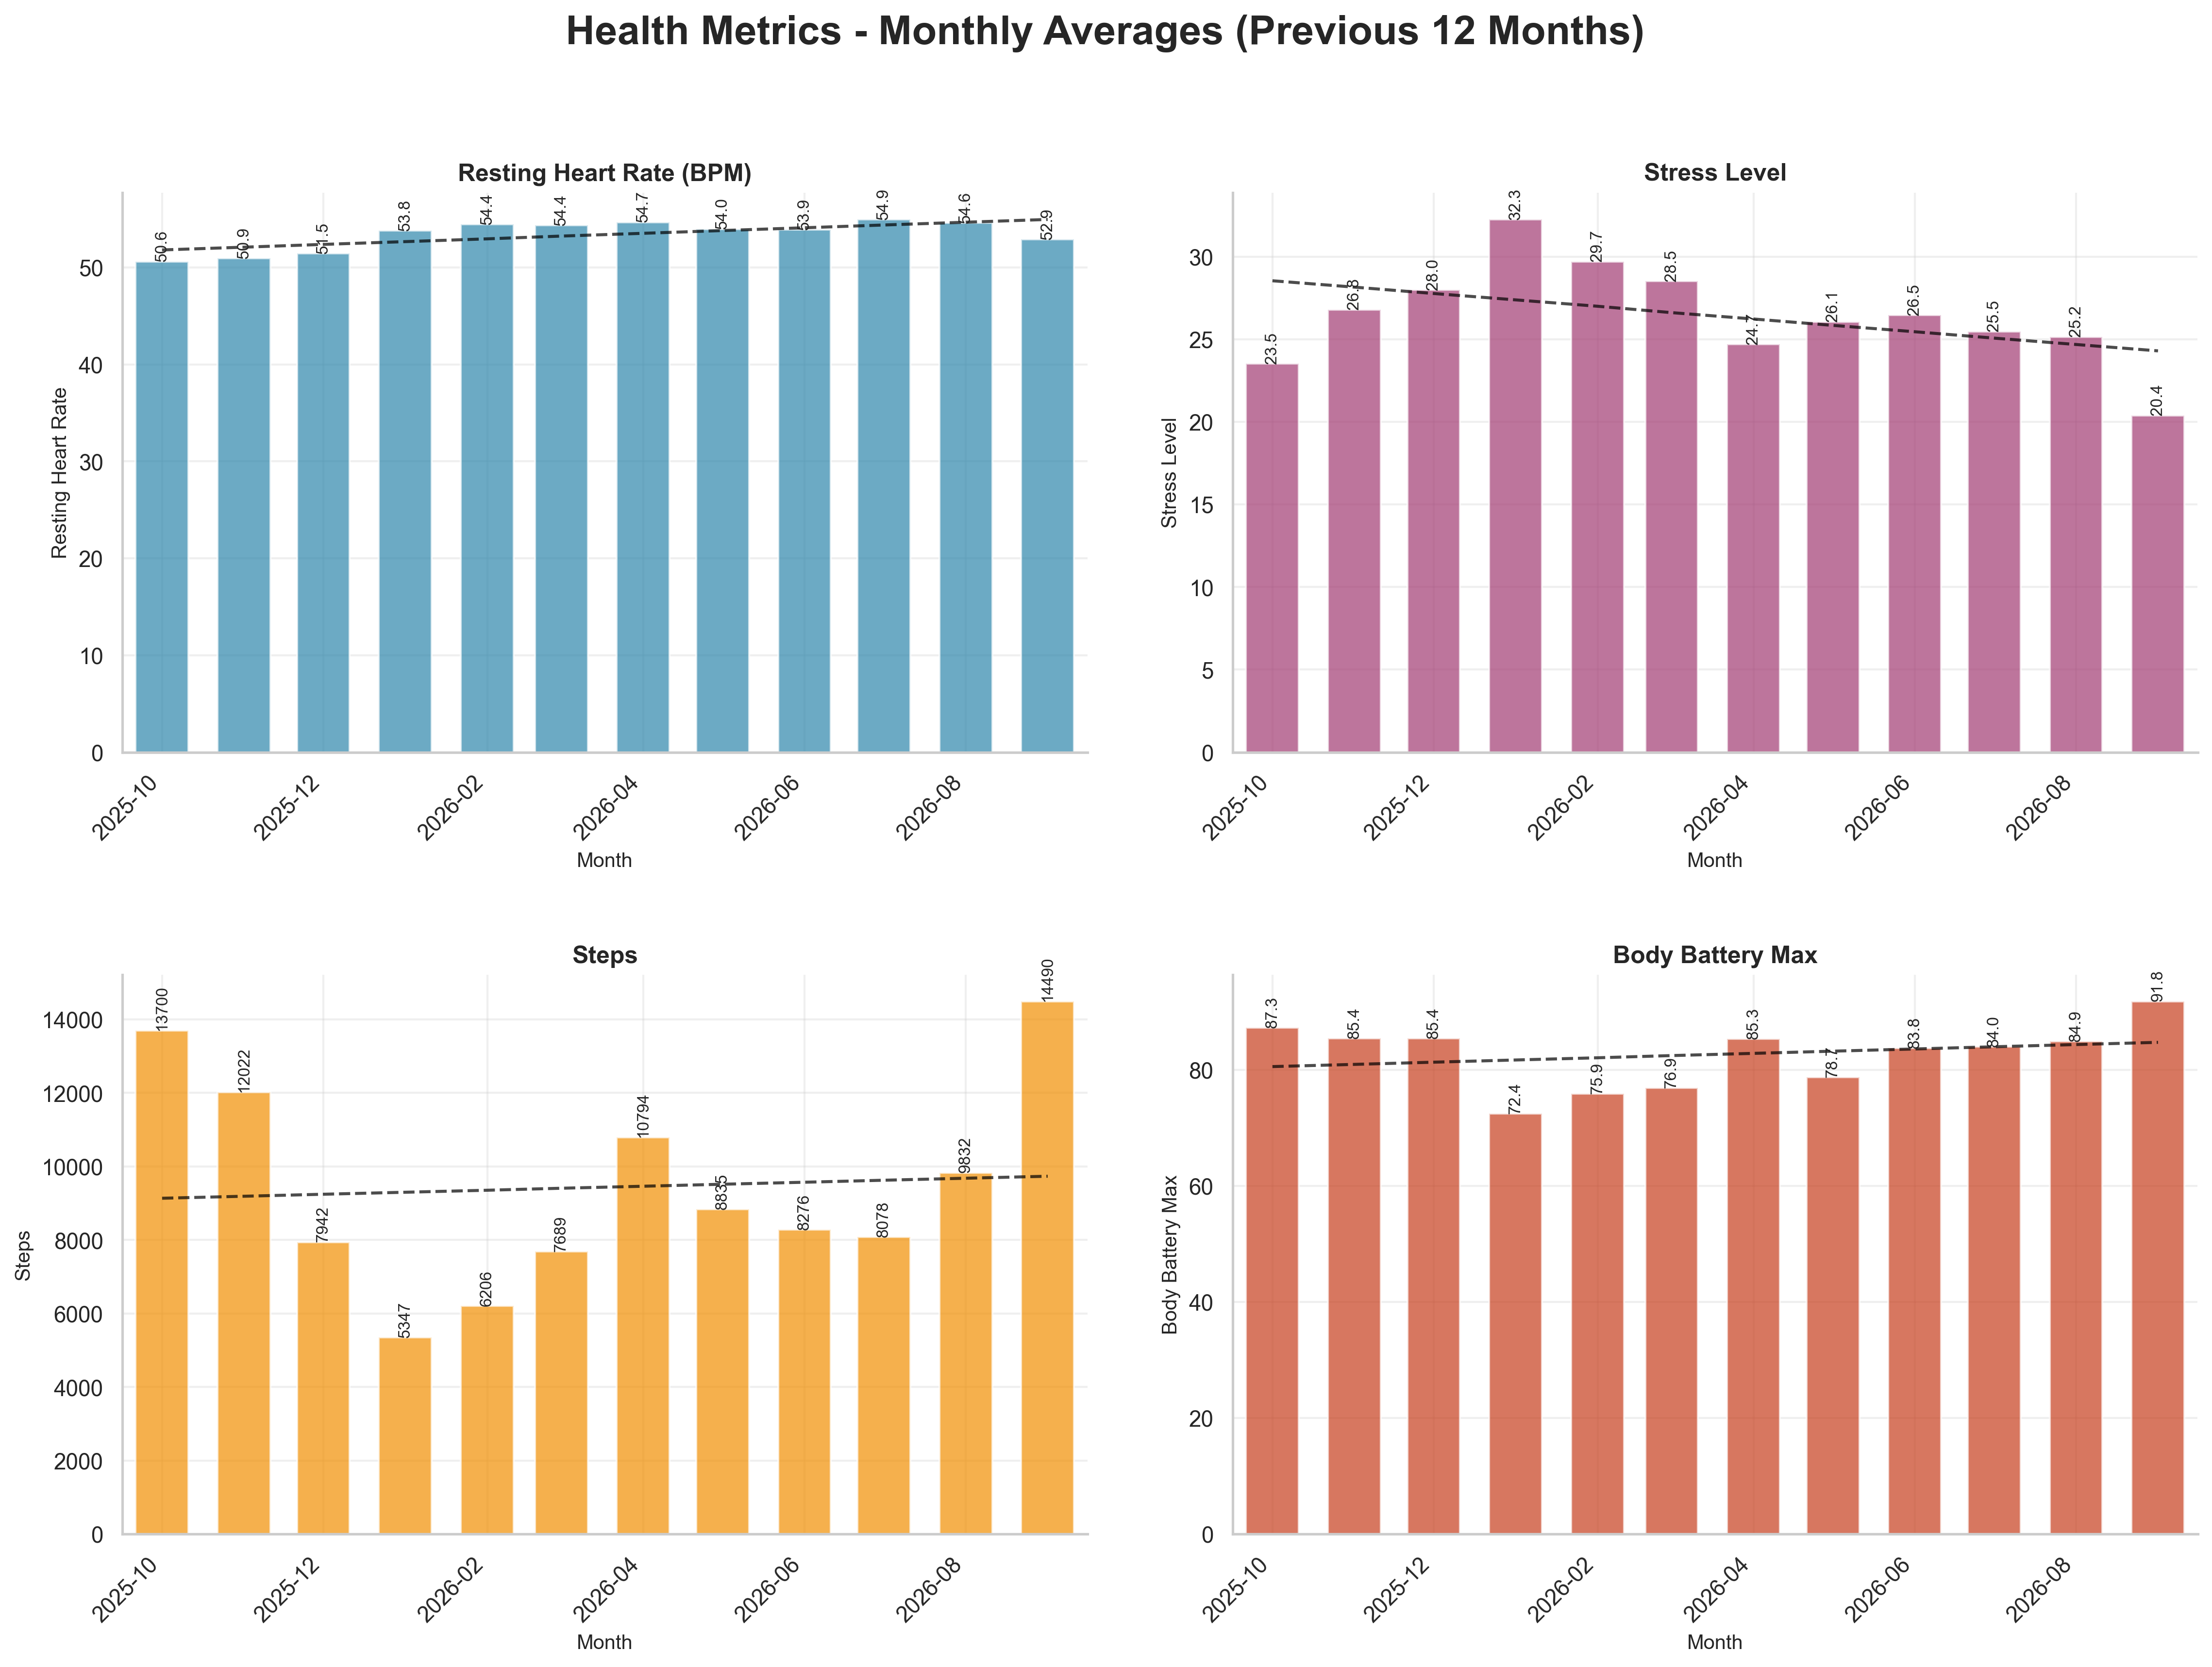
- Average stress fell from 25.8 in Q2 to 23.7 in Q3 (92 days), with September the calmest month at 20.4.
- Average max body battery rose from 82.6 to 86.8 (92 days), reaching 91.8 in September.
- Average daily steps rose from 9,297 to 10,760, from 8,078 in July to 14,490 in September.
- Average active calories rose from 537 in Q2 (363 in Q1) to 705 in Q3, with September at 941.
- Average daily intensity rose from 75 to 105 intensity minutes.
- Average sleep score edged up from 79.2 to 80.0 across 92 scored nights. Average sleep duration was 7.37 hours (7.43 in Q2).
- Average resting heart rate was flat at 54.2 bpm versus 54.2 in Q2, but fell to 52.9 in September after sitting near 55 in July and August.
- VO2 max averaged 48.1 across 41 readings (range 47 to 49) versus 46.8 in Q2.
The September jump stands out. Steps, intensity, stress, body battery, and resting heart rate all improved together that month, which is the main reason the quarter averages look better than July and August alone.
Correlations for the quarter:
Correlation notes:
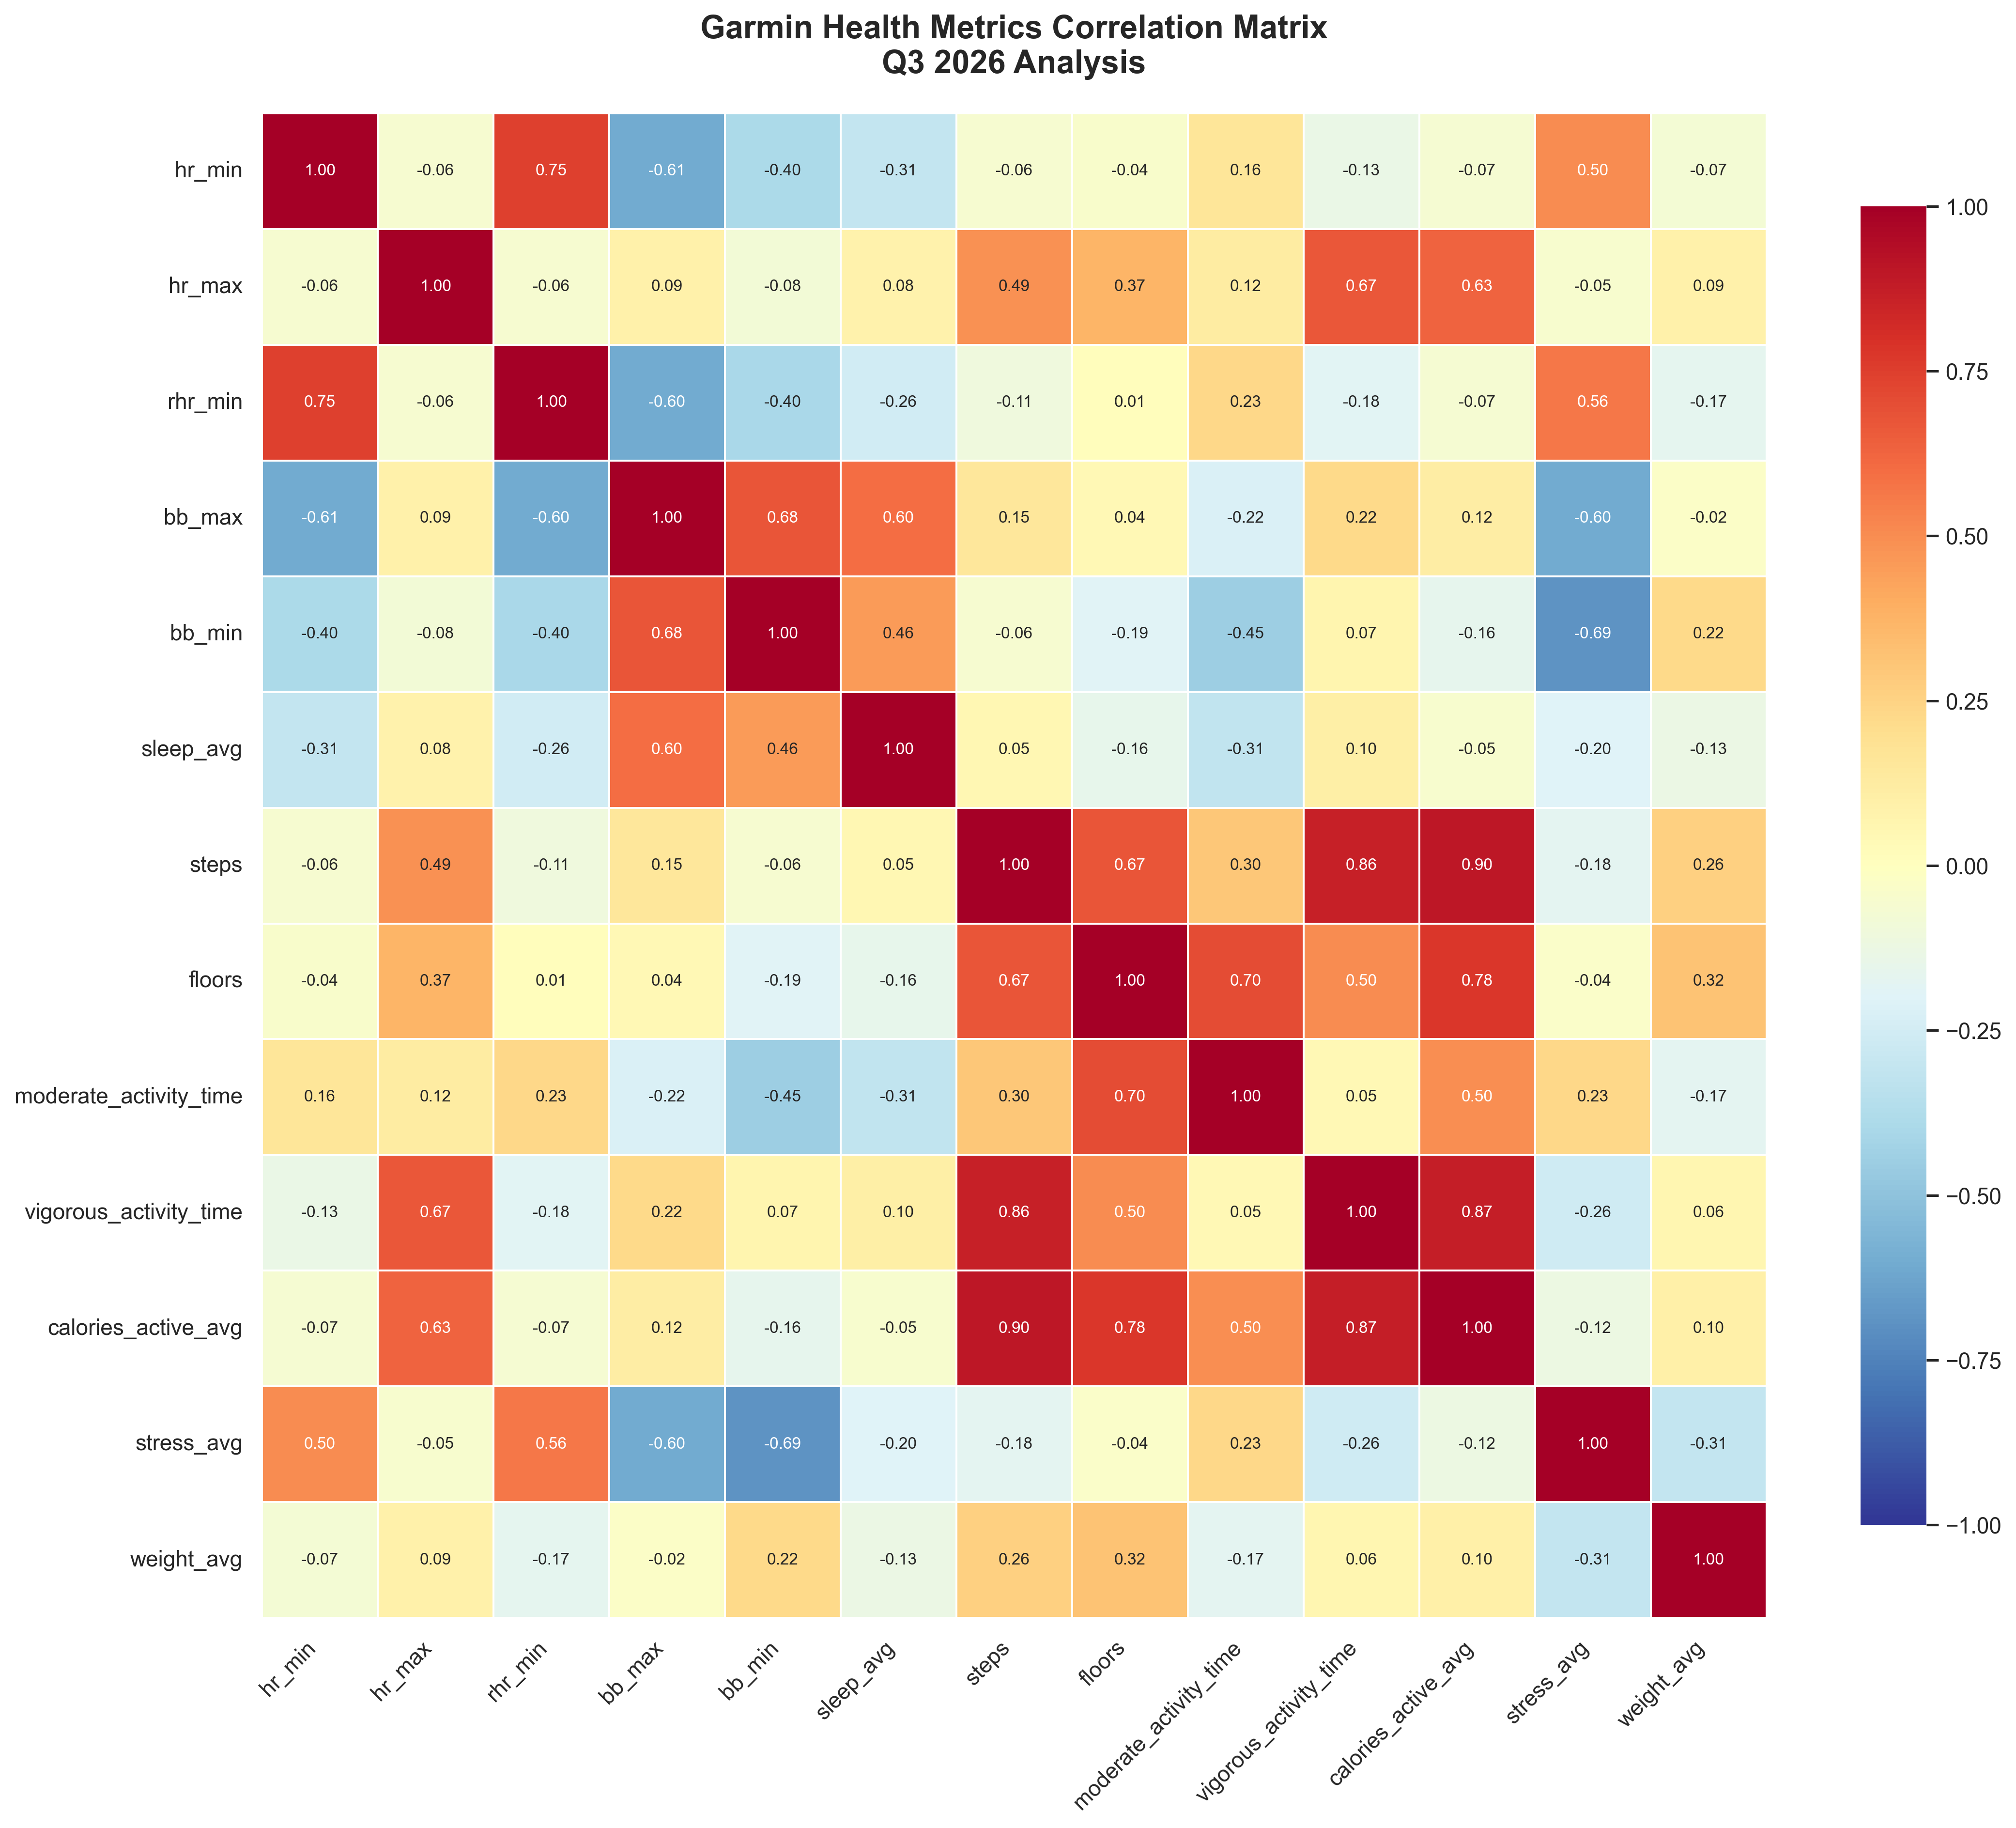
- Steps and vigorous activity time were the strongest pair (0.86), which is intuitive: the big step days are the run and hike days. Active calories tracked steps (0.90) and vigorous time (0.87) almost as closely.
- Minimum heart rate tracked resting heart rate closely (0.75), so the two are measuring much the same thing.
- Minimum body battery moved opposite to stress (-0.69), and max body battery tracked sleep score (0.60). Recovery metrics move together, and stress still sits against them.
- Floors climbed correlated with both steps (0.67) and moderate activity time (0.70), reflecting the hiking weeks.
Let us go through how the quarter looked by focus area.
Improve Fitness
Goals
- Average intensity minutes (Garmin) of 800 or above ⚠️
- Improve VO2 max ✅
- Decrease RHR ⚠️
Analysis
I look at intensity minutes as a way to make sure I am getting enough fitness, regardless of whether I am running, at the gym, or kayaking.
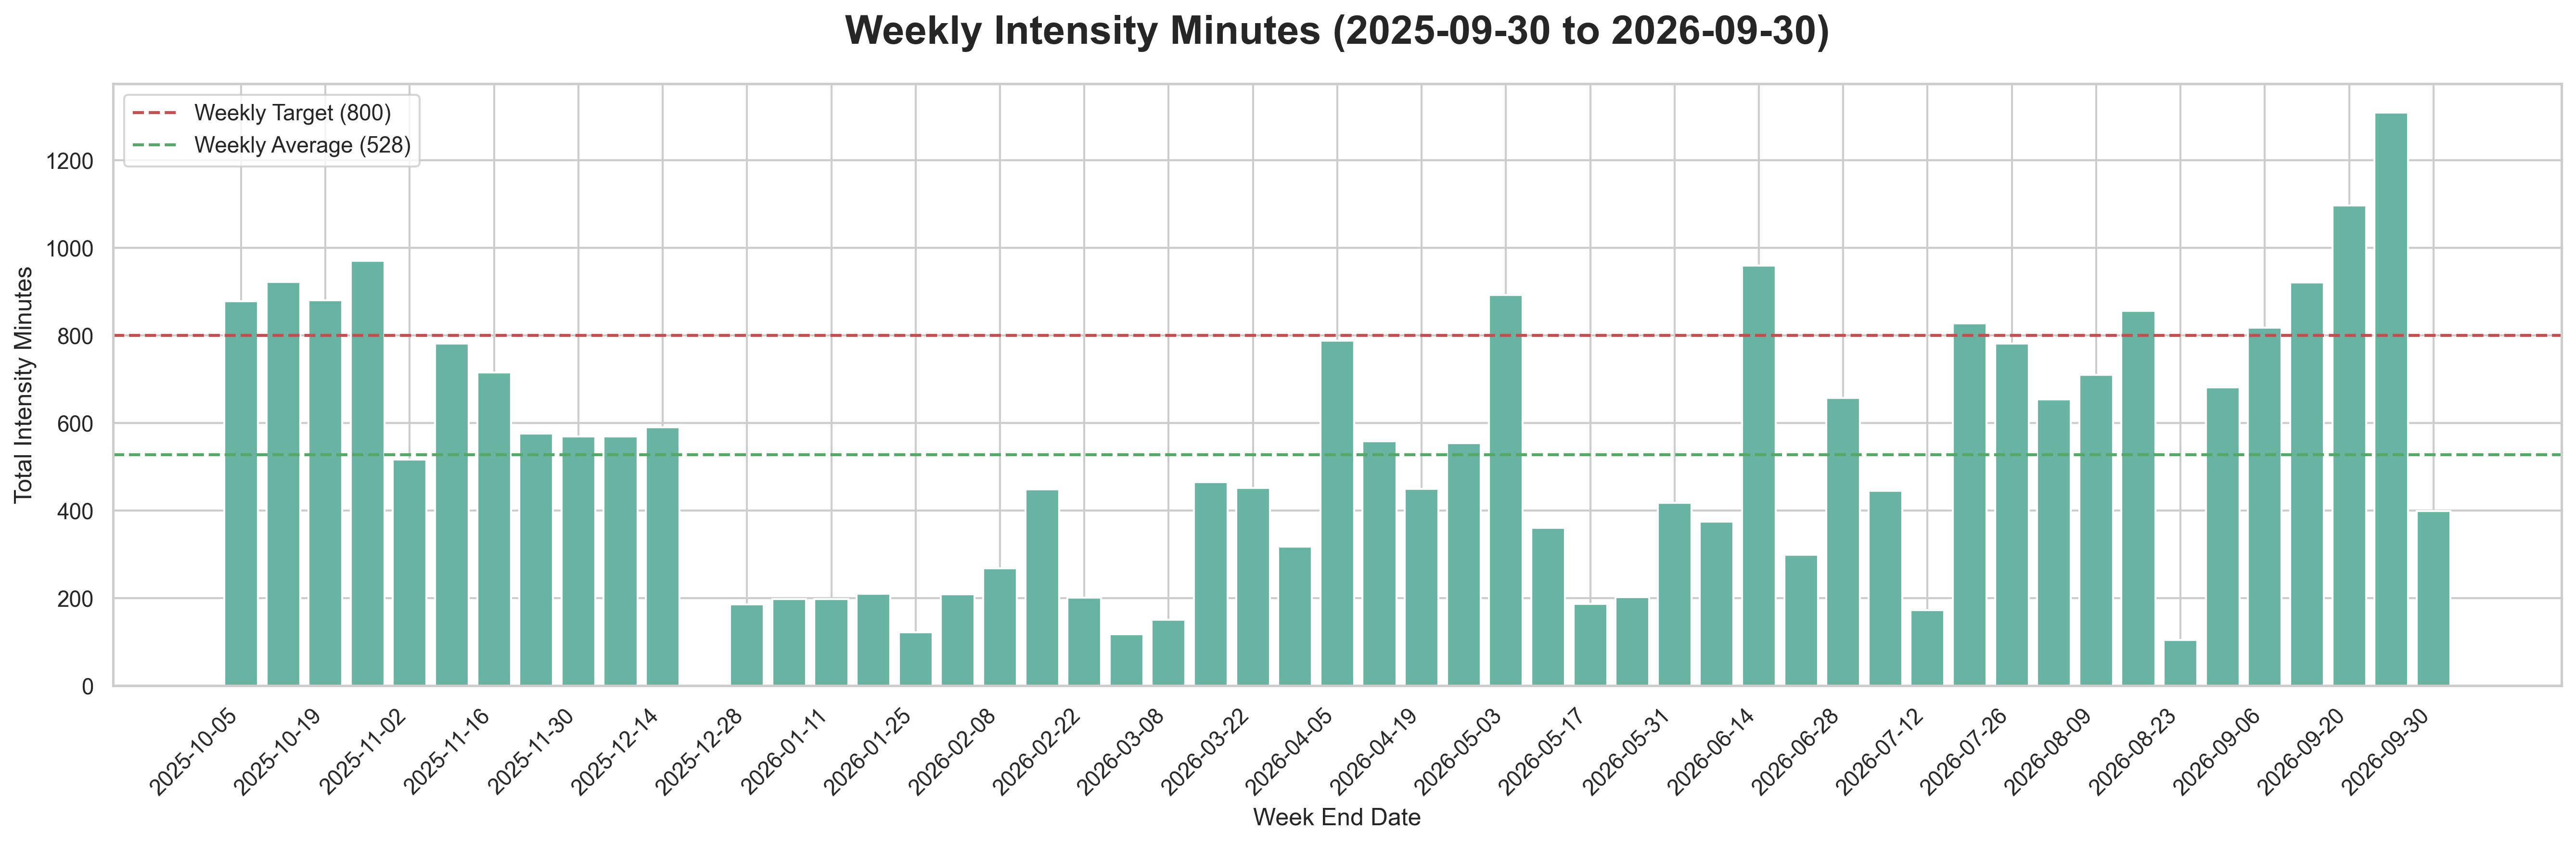
Q3 was a clear step up from Q2 but still short of the target on average:
- Weeks counted: 14 week-ending buckets
- Average weekly intensity minutes: 698.4
- Median weekly intensity minutes: 745.5
- Weeks at or above 800 minutes: 6 of 14
- Best week: 1,309 minutes, week ending September 27
- Lowest full week: 105 minutes, week ending August 23
For comparison, Q2 averaged 459 minutes with just 1 of 14 weeks above 800. The last four full weeks of the quarter (818, 921, 1,097, 1,309) were all above target, while July and the first half of August were choppier, including the 173-minute week ending July 12 and the 105-minute week ending August 23.
Resting heart rate:
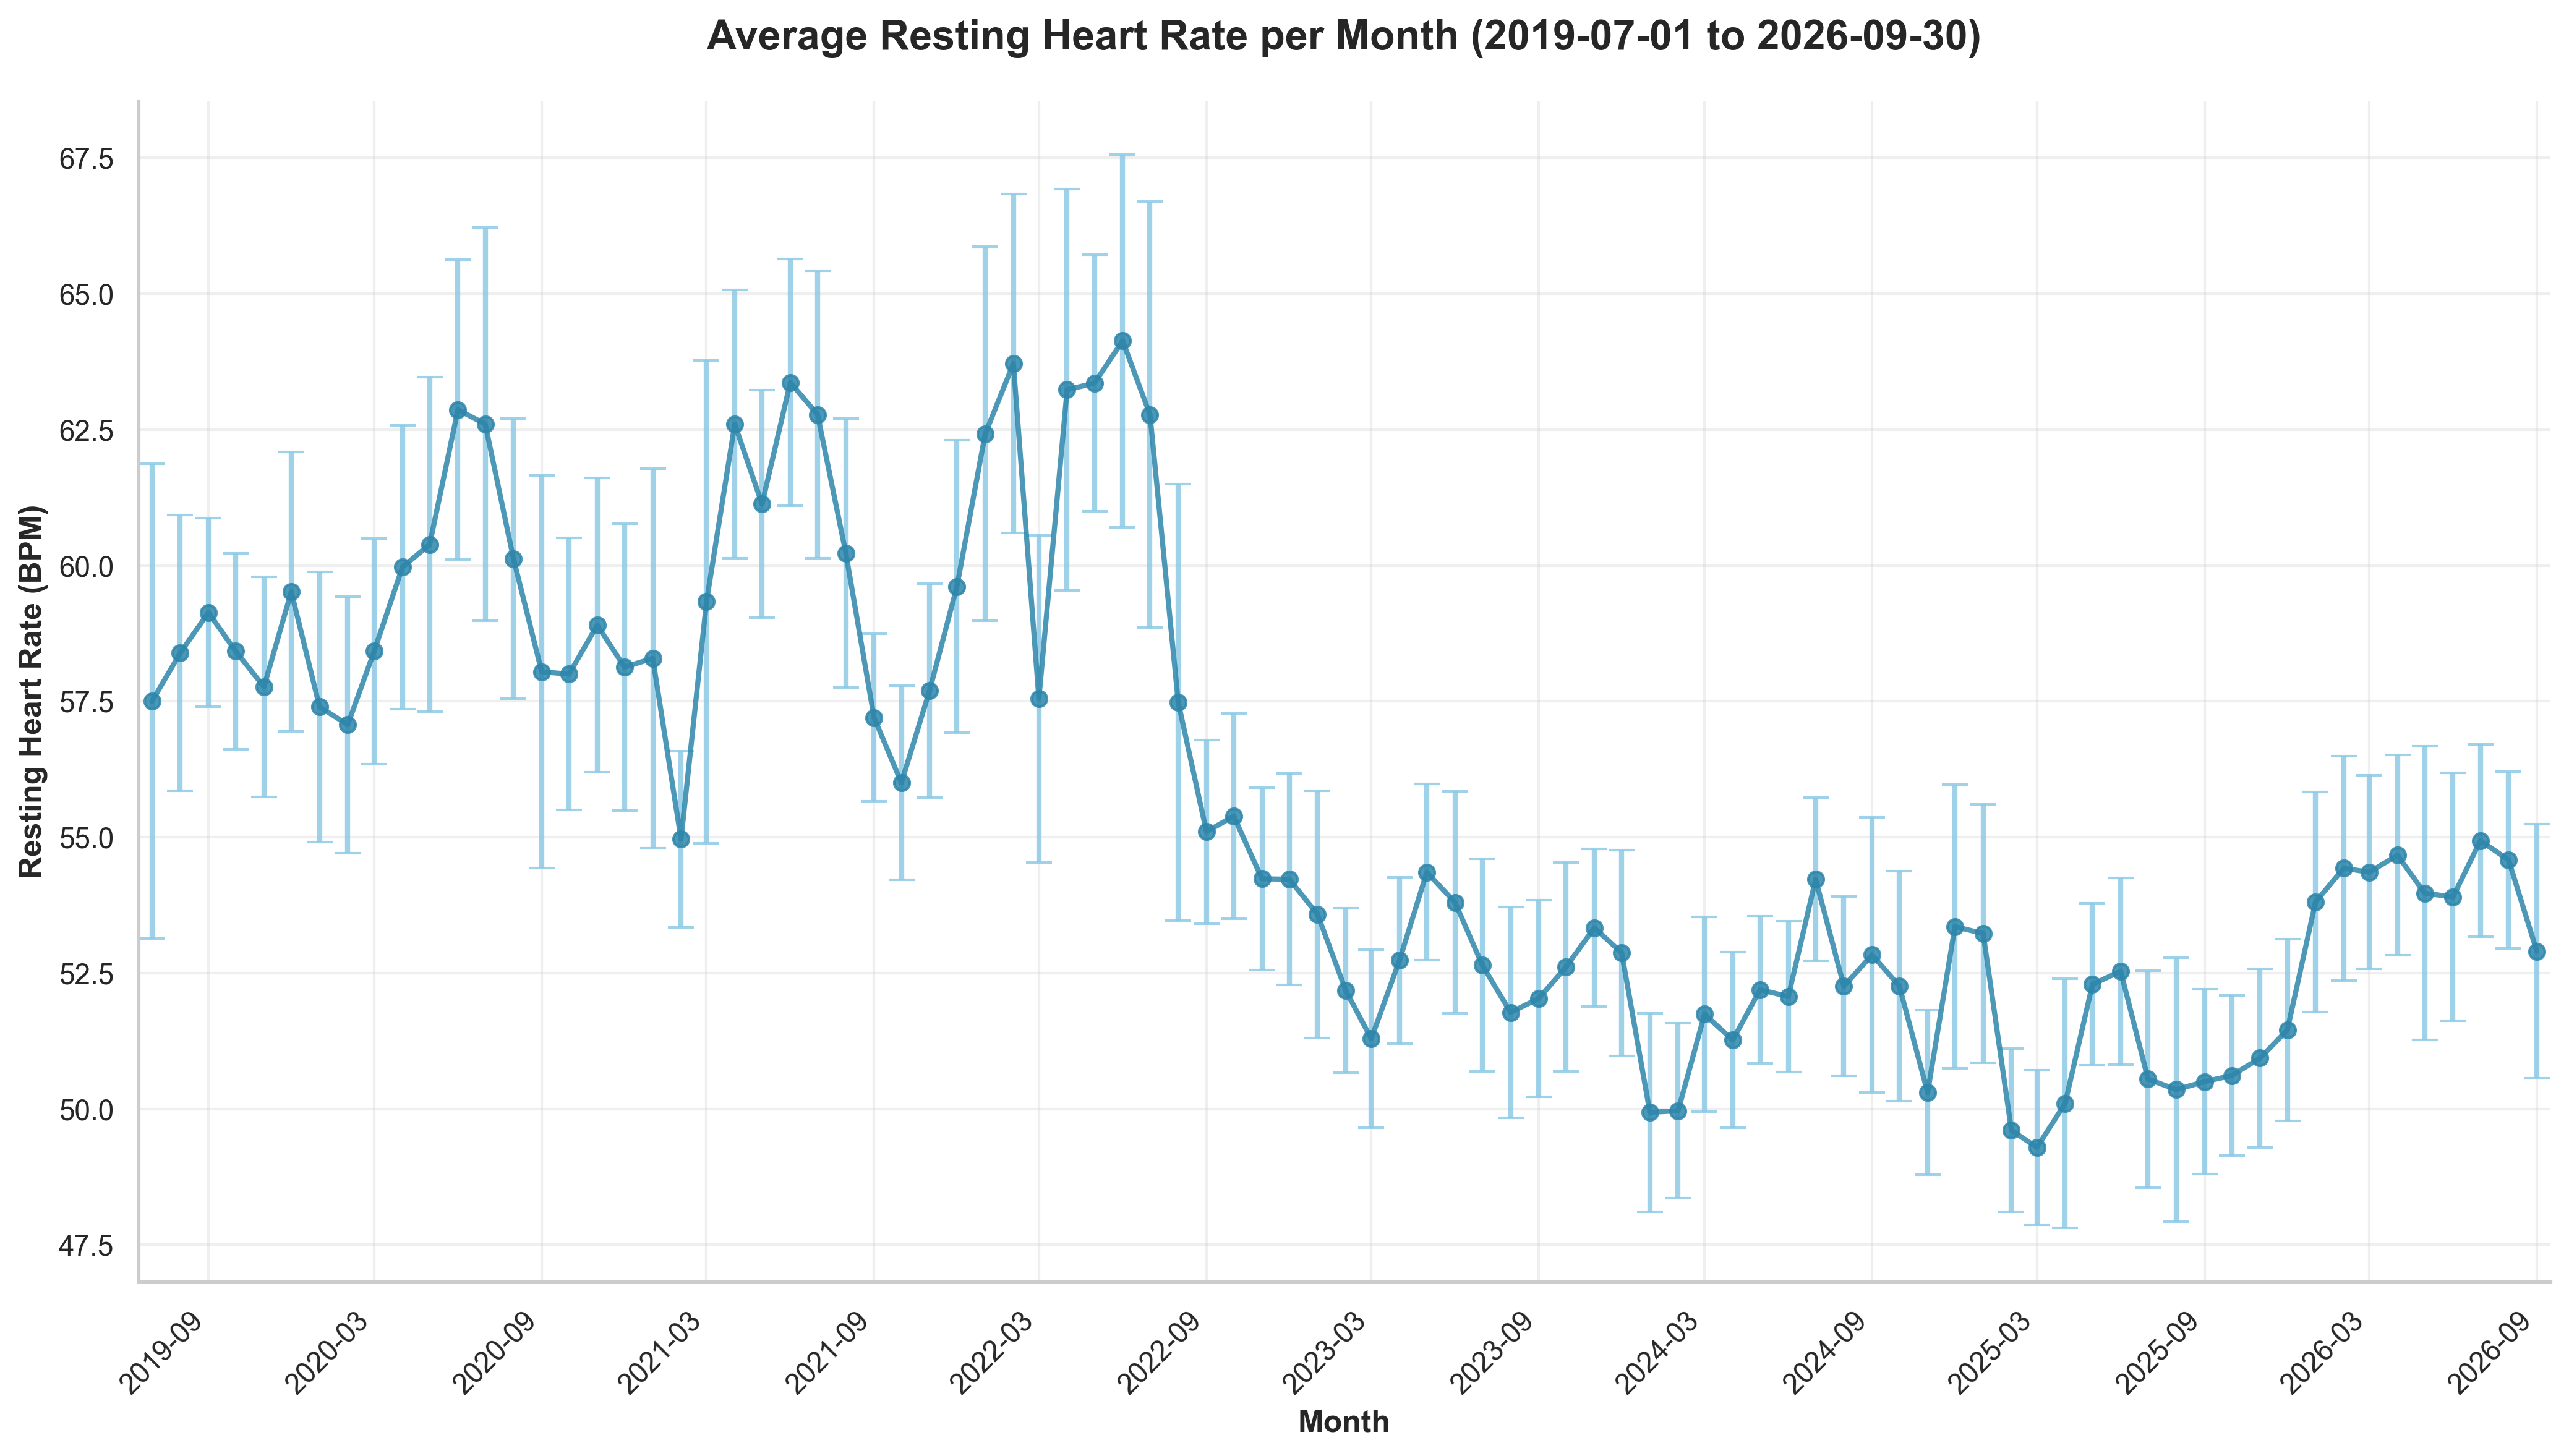
Average RHR was 54.2 bpm, flat against Q2. Monthly RHR was 54.9 in July, 54.6 in August, and 52.9 in September, so the improvement came late in the quarter.
Active calories rose steadily through the quarter:
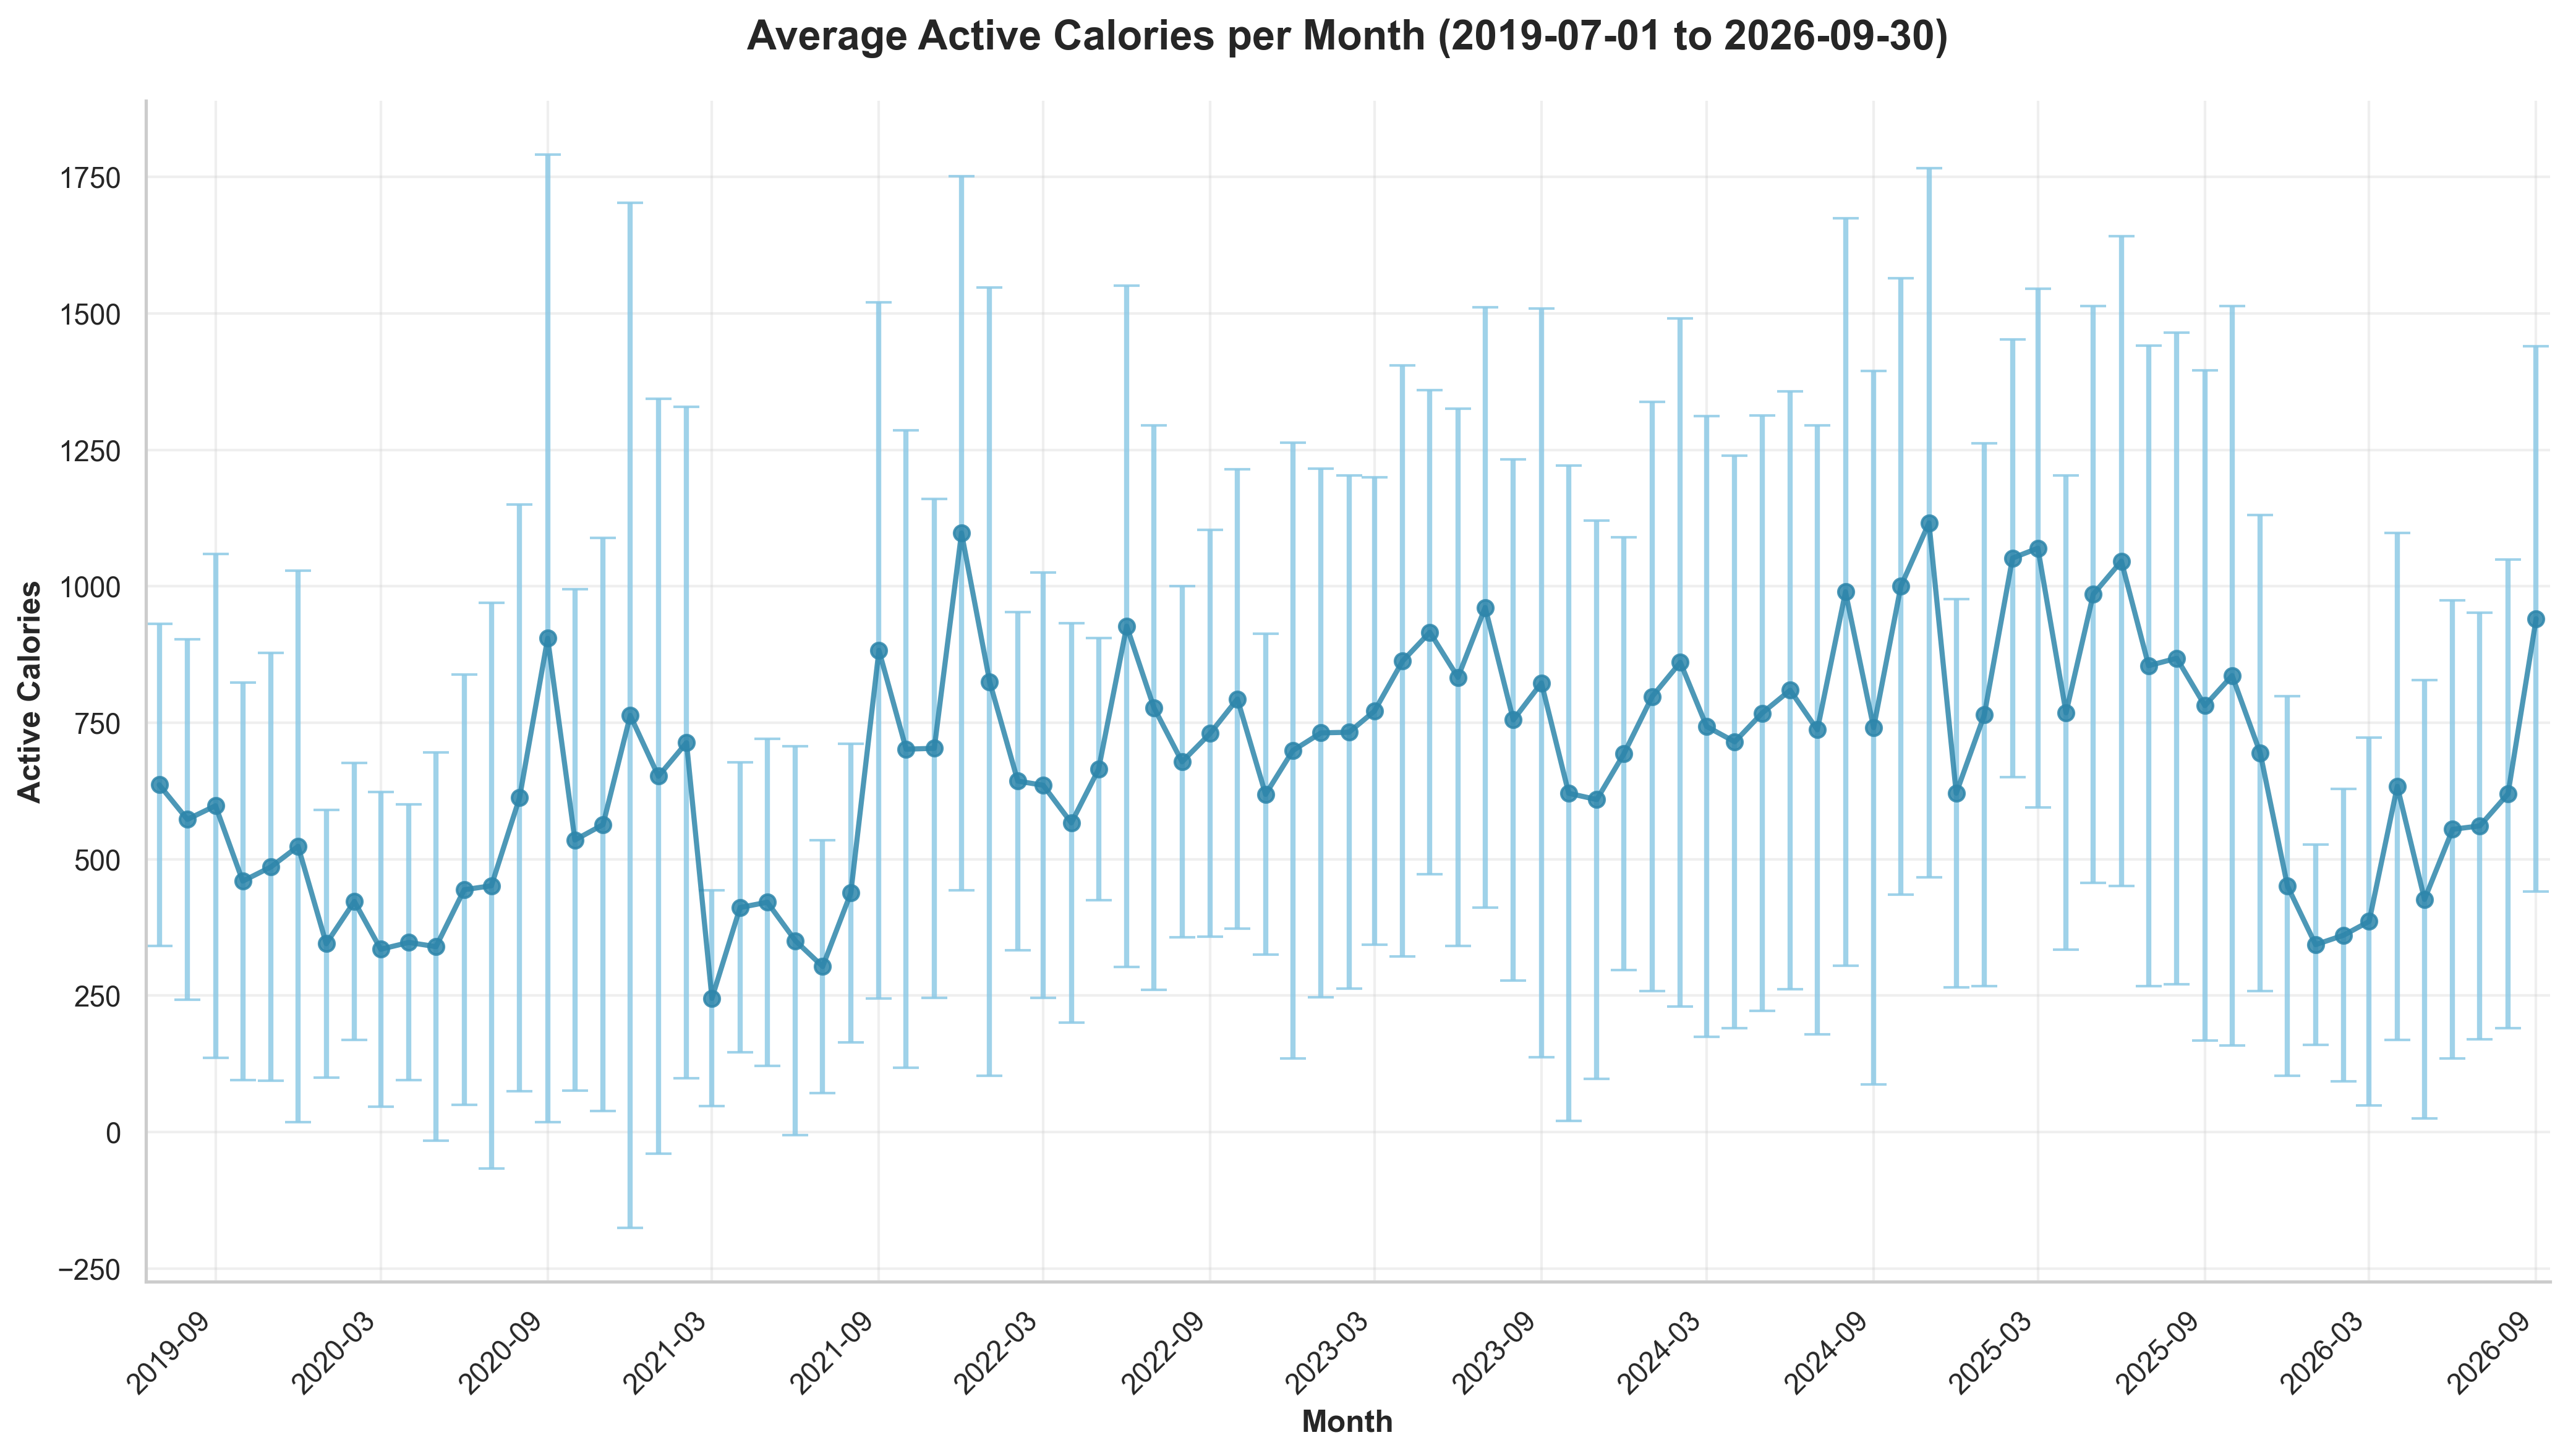
The daily average was 561 in July, 620 in August, and 941 in September, against 537 for the whole of Q2. Sunday (1,015) and Saturday (889) were the highest days, which fits long weekend runs and hikes.
VO2 max had 41 readings across the quarter:
- Minimum: 47
- Maximum: 49
- Average: 48.1
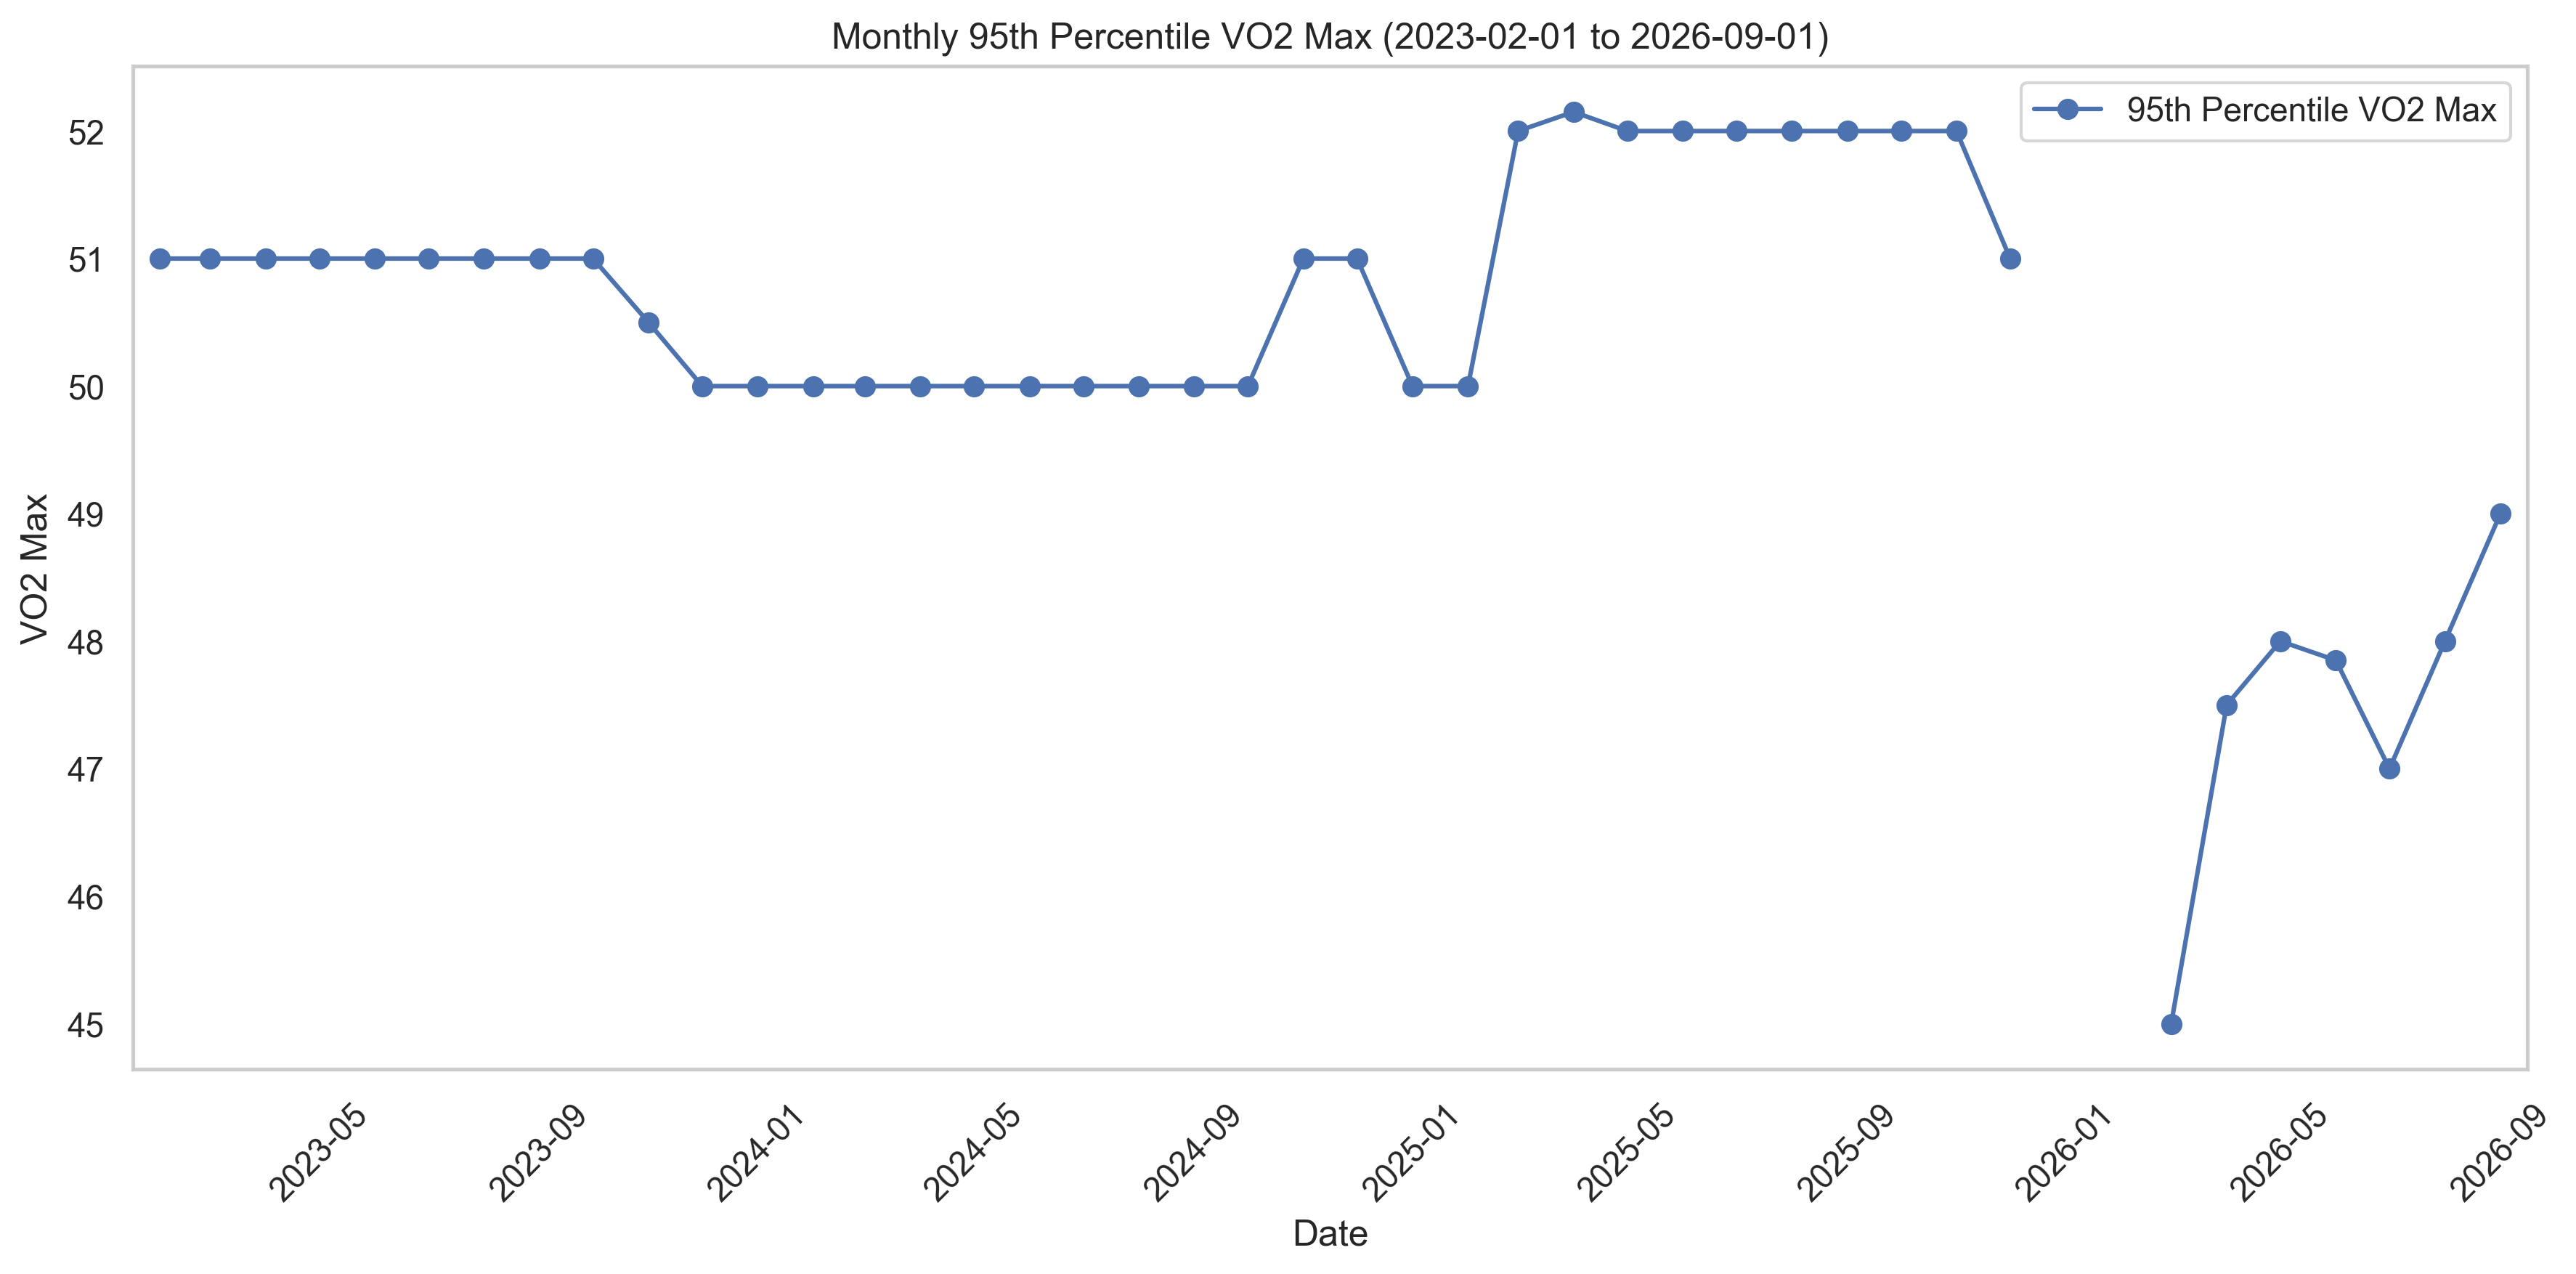
Readings averaged 47.0 in July, 47.8 in August, and 48.6 in September, and ended the quarter at 49. The “above 50” goal from Q2 is not met yet, but the direction is right.
The activity mix looks well balanced: 134 activities in Q3 versus 119 in Q2, led by 45 runs (including 2 trail and 2 treadmill), 41 strength sessions, 36 walks, and 7 hikes. Running totalled roughly 366 km over about 41 hours, and hiking added 45 km over about 24 hours.
Experiments
The Q2 plan was to make ordinary weeks repeatable and to increase strength training substantially. Both are supported by the data: the last four full weeks cleared the 800-minute target, and 41 strength sessions is roughly three per week. The dips in July and August are what held the quarter back, not a lack of training ideas.
Improve Sleep
Goals
- Keep average sleep score above 80 ✅
Analysis
Sleep finally reached the target, only just.
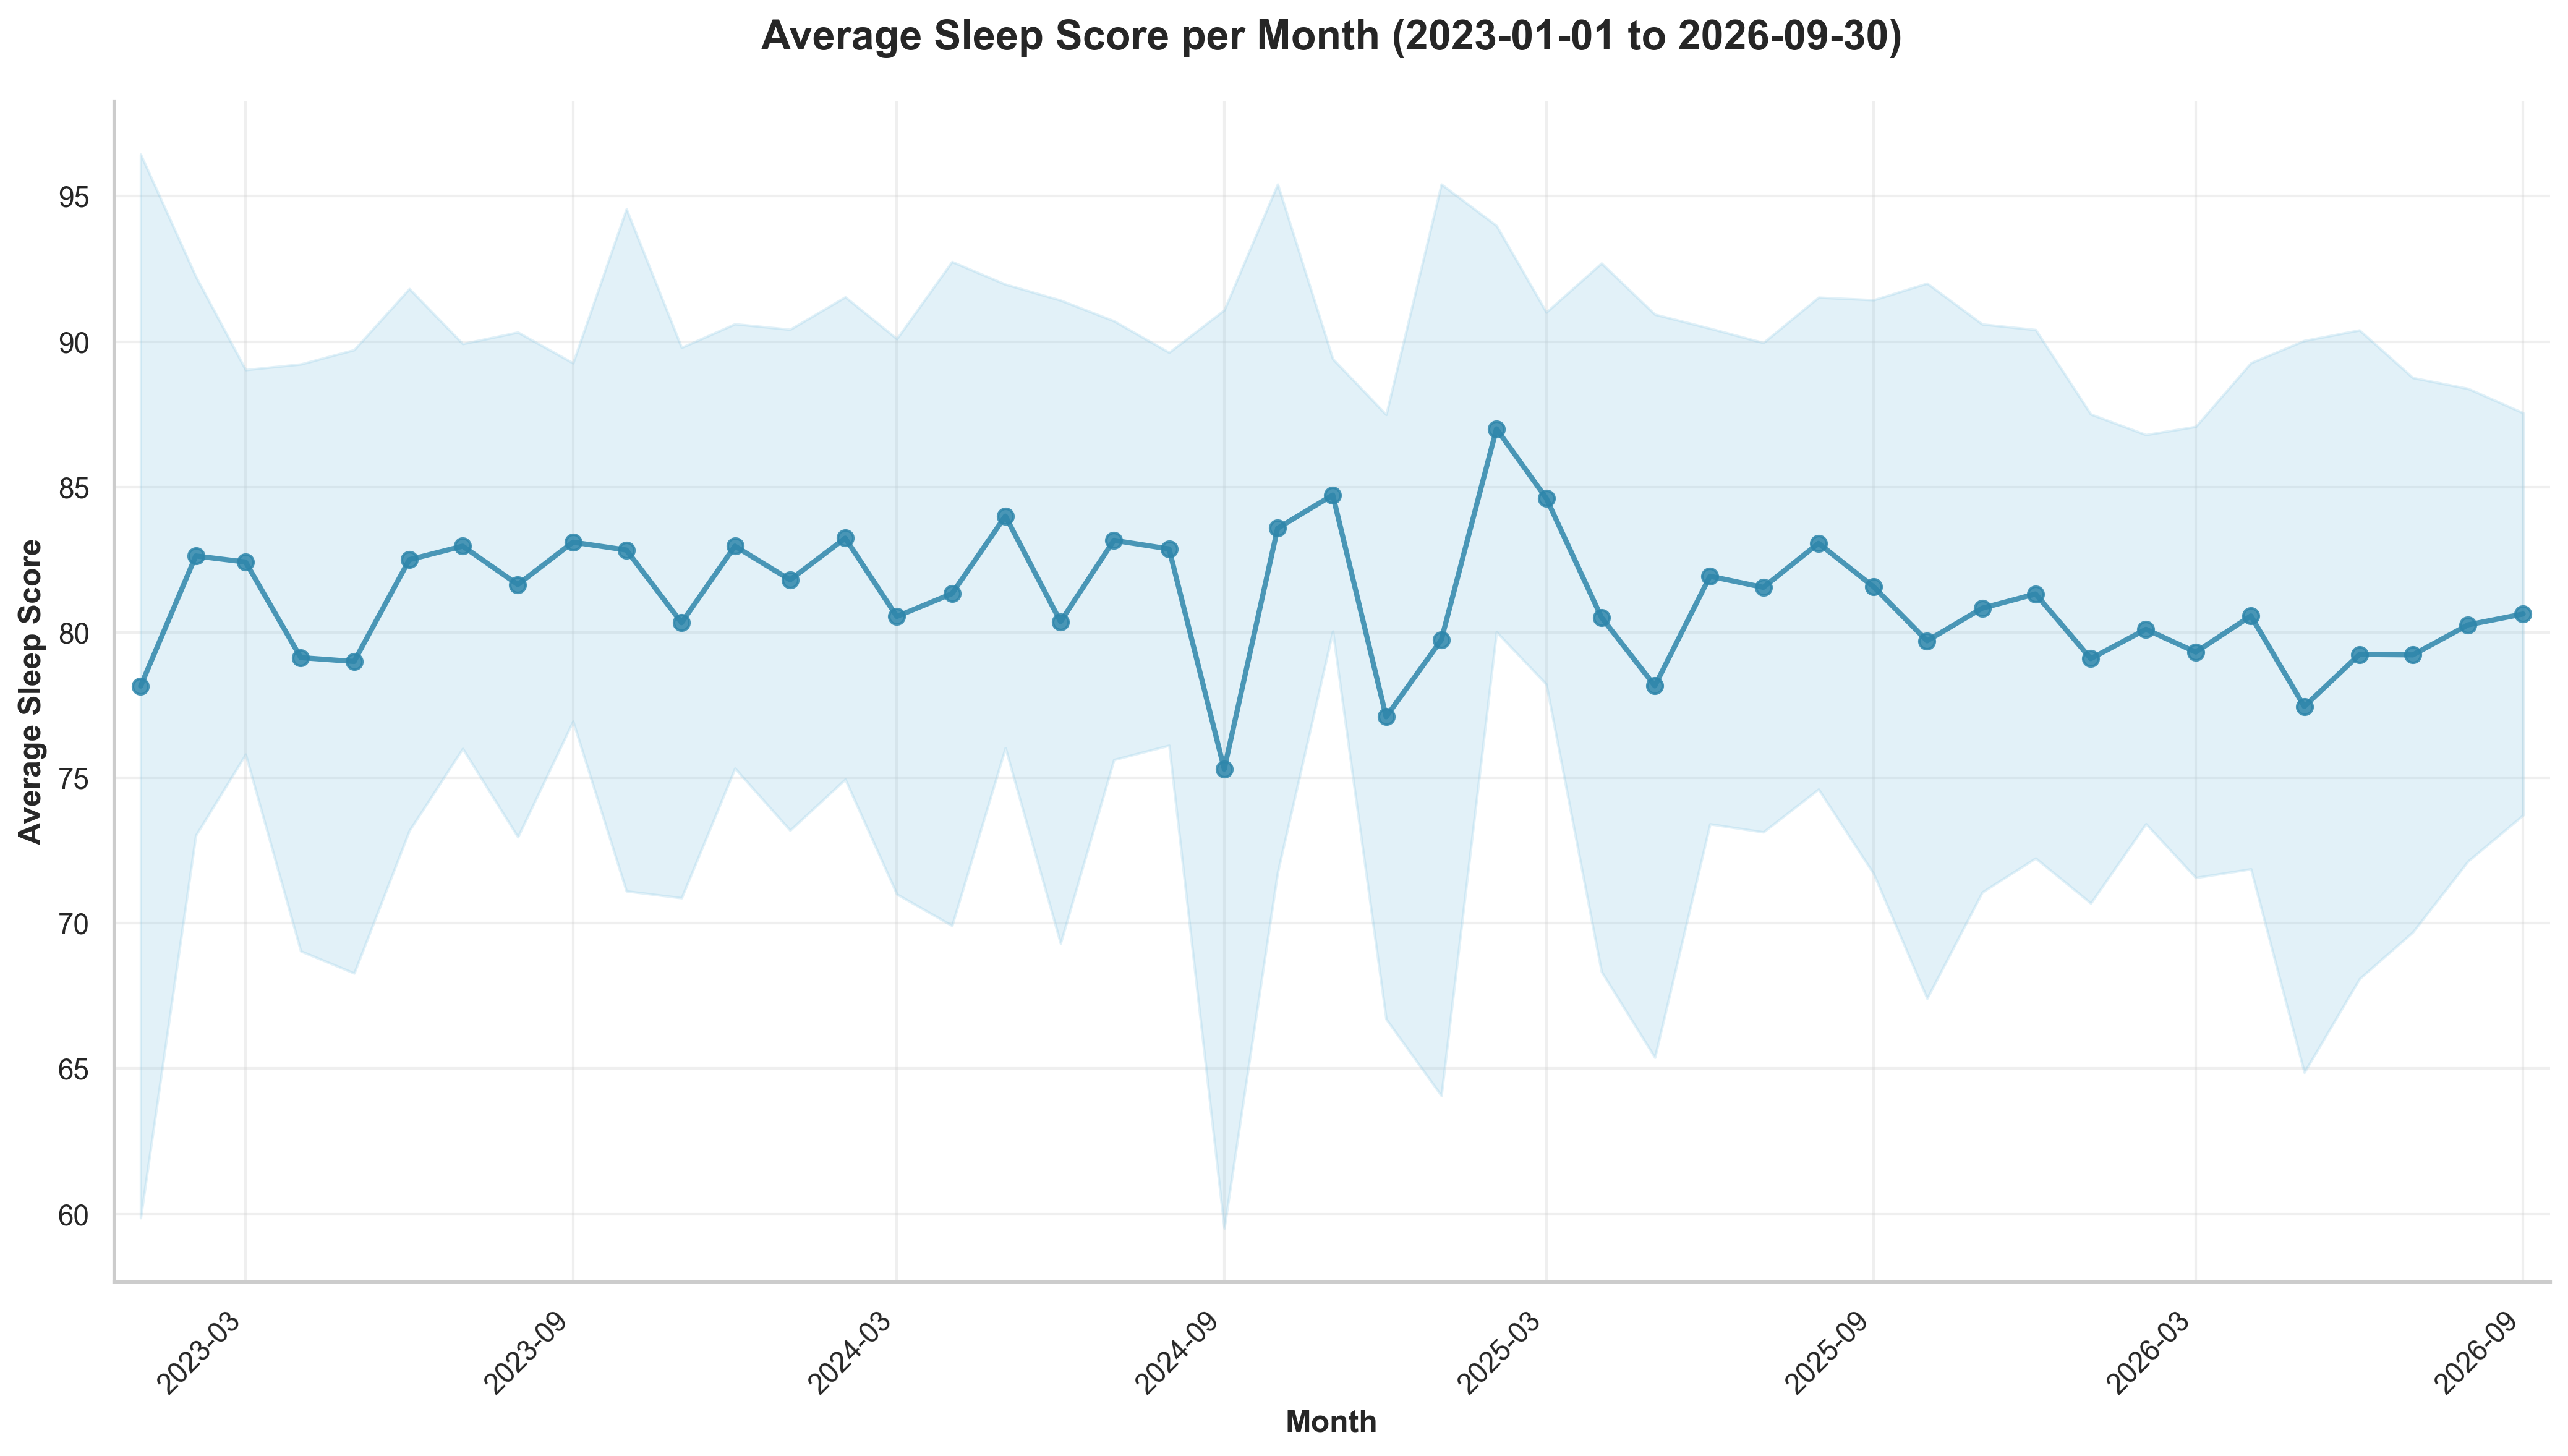
For Q3:
- Nights with sleep-score data: 92
- Average sleep score: 80.0 (range 51 to 95; 57 nights at 80 or above)
- Average sleep duration: 7.37 hours
- Q2 comparison: 79.2 average sleep score and 7.43 hours average sleep duration
Monthly sleep score was 79.2 in July, 80.3 in August, and 80.6 in September, a small but steady improvement and no repeat of May’s dip from Q2.
Day-of-week sleep pattern:
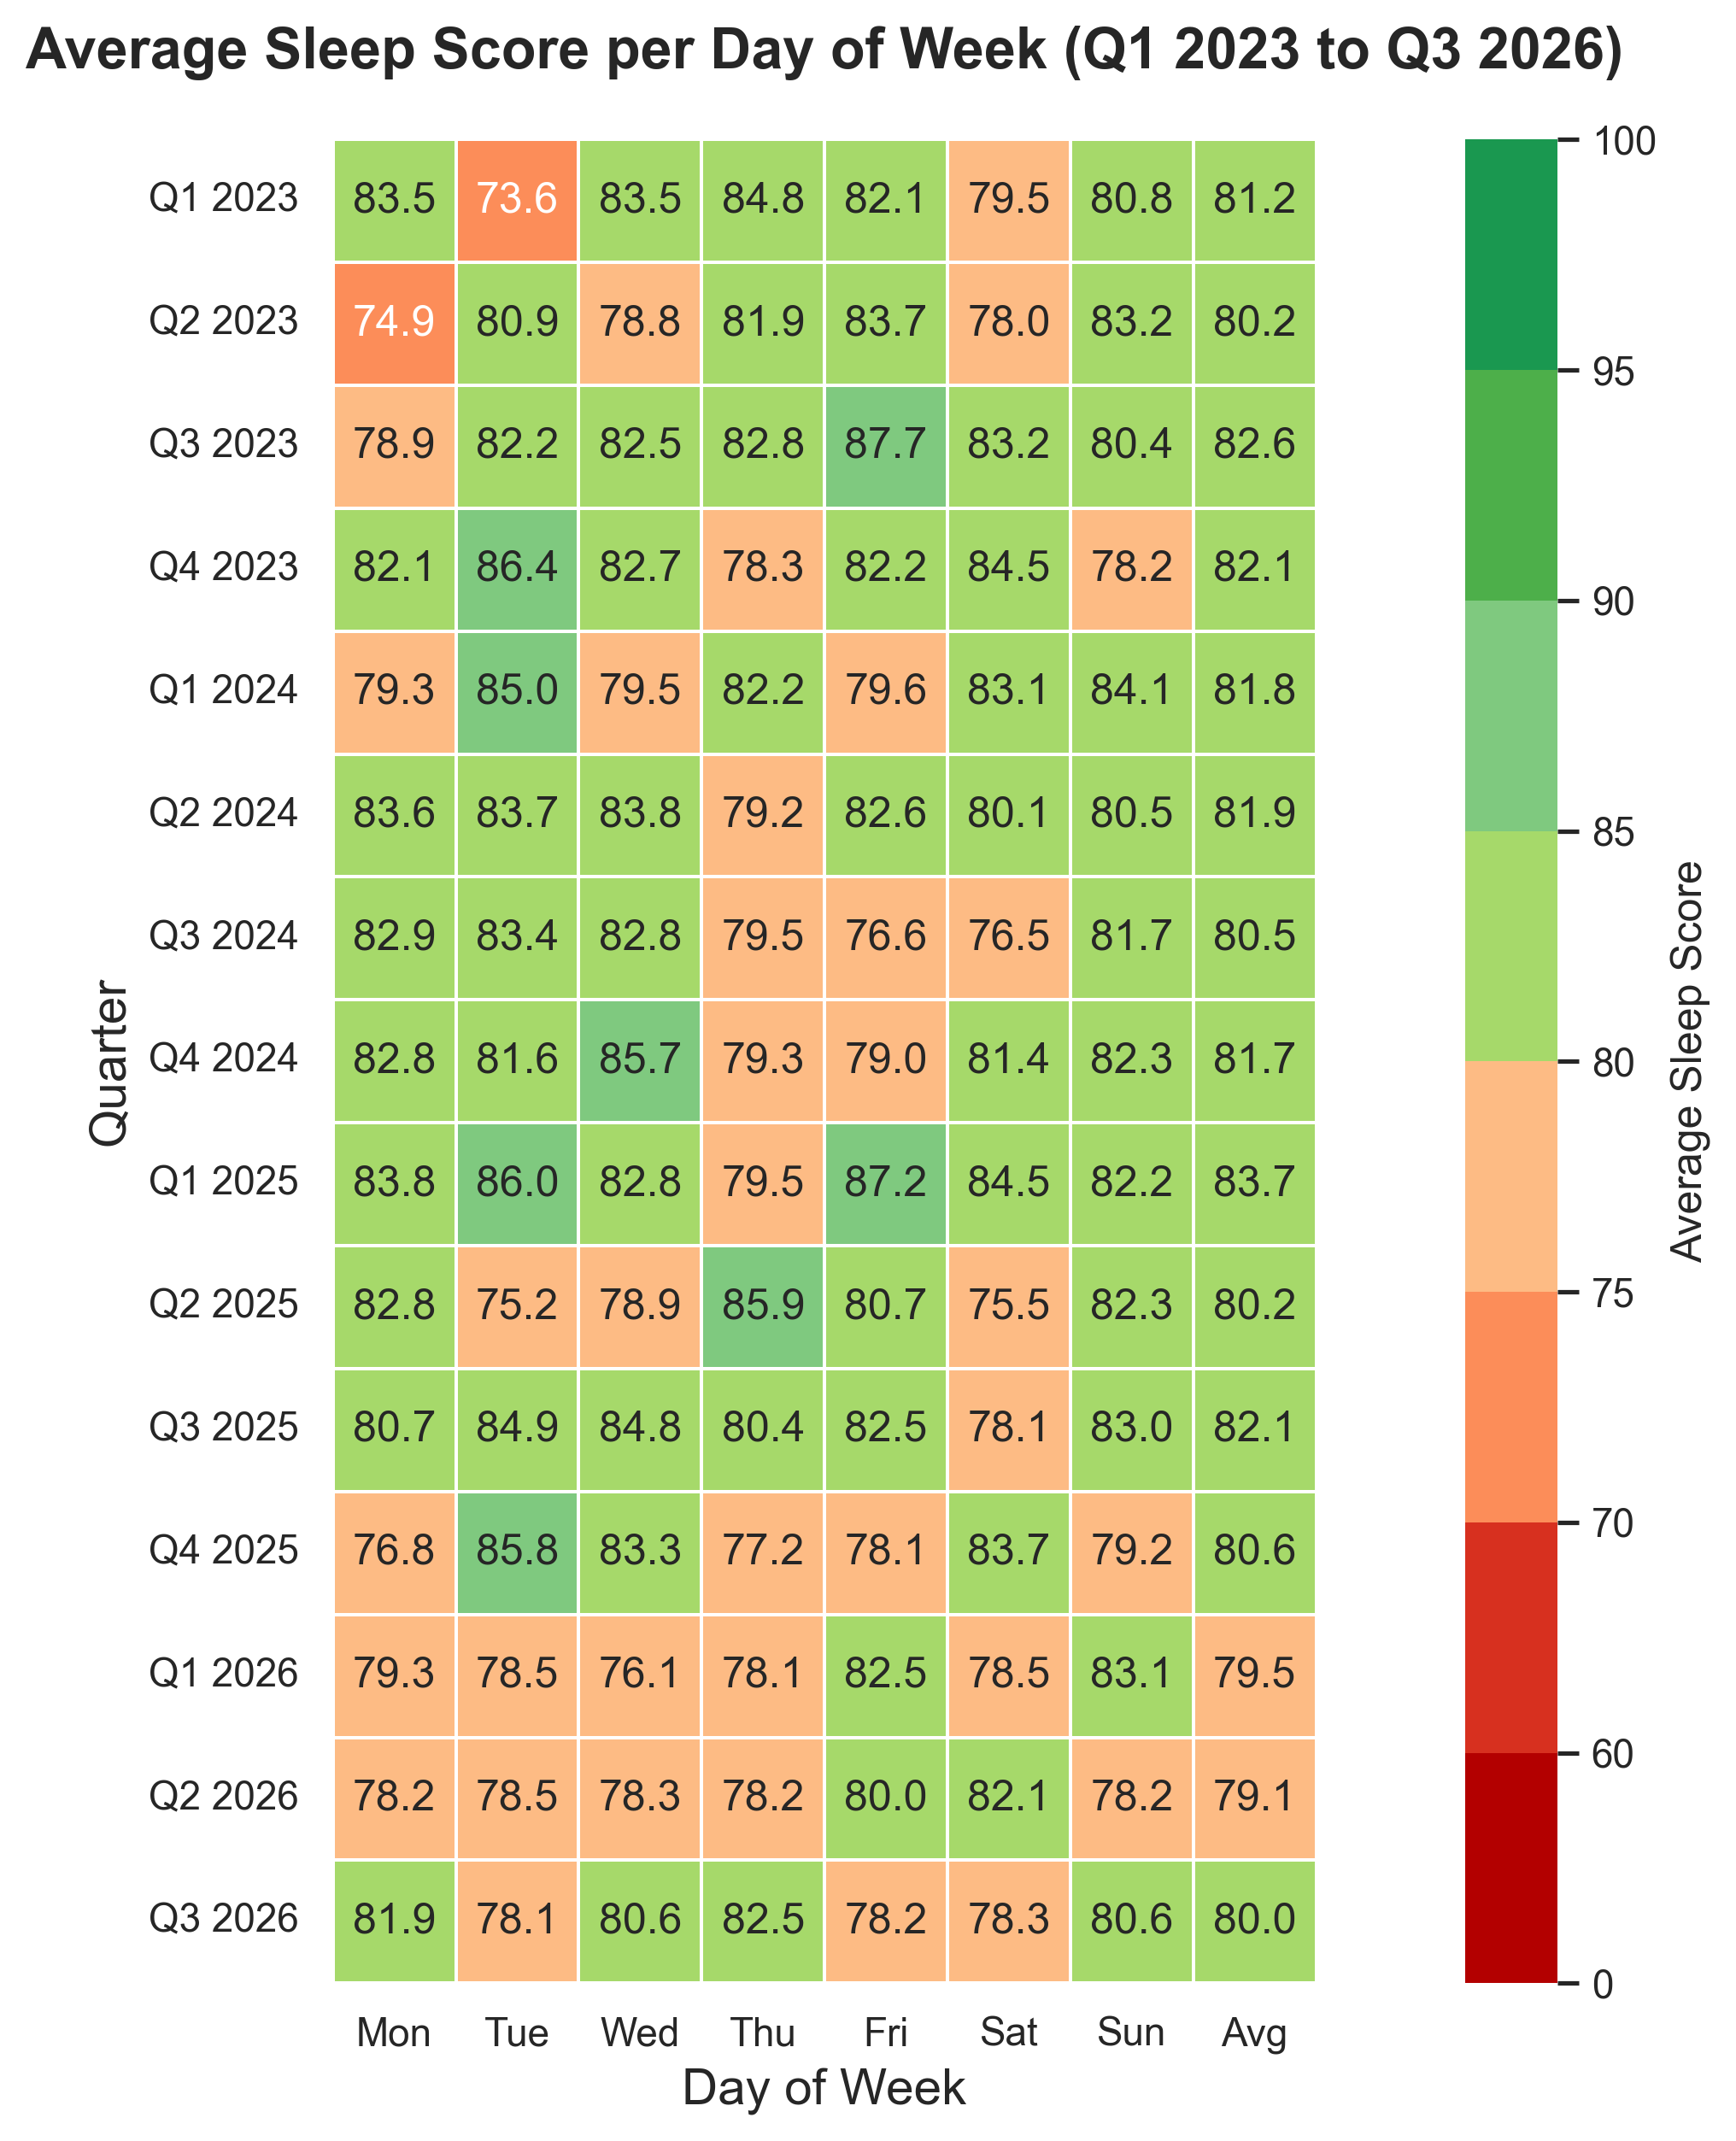
The strongest sleep-score days were Thursday (82.5, 13 nights) and Monday (81.9, 13 nights). The weakest were Tuesday (78.1), Friday (78.2), and Saturday (78.3). The gap between best and worst day is only about 4 points, but Friday and Saturday nights remain the soft spot.
Experiments
Average duration slipped slightly while the score improved, which suggests sleep quality rather than quantity drove the gain.
No new sleep experiments were run in this quarter.
Decrease Stress
Goals
- Decrease stress ✅
Analysis
Stress continued to improve.
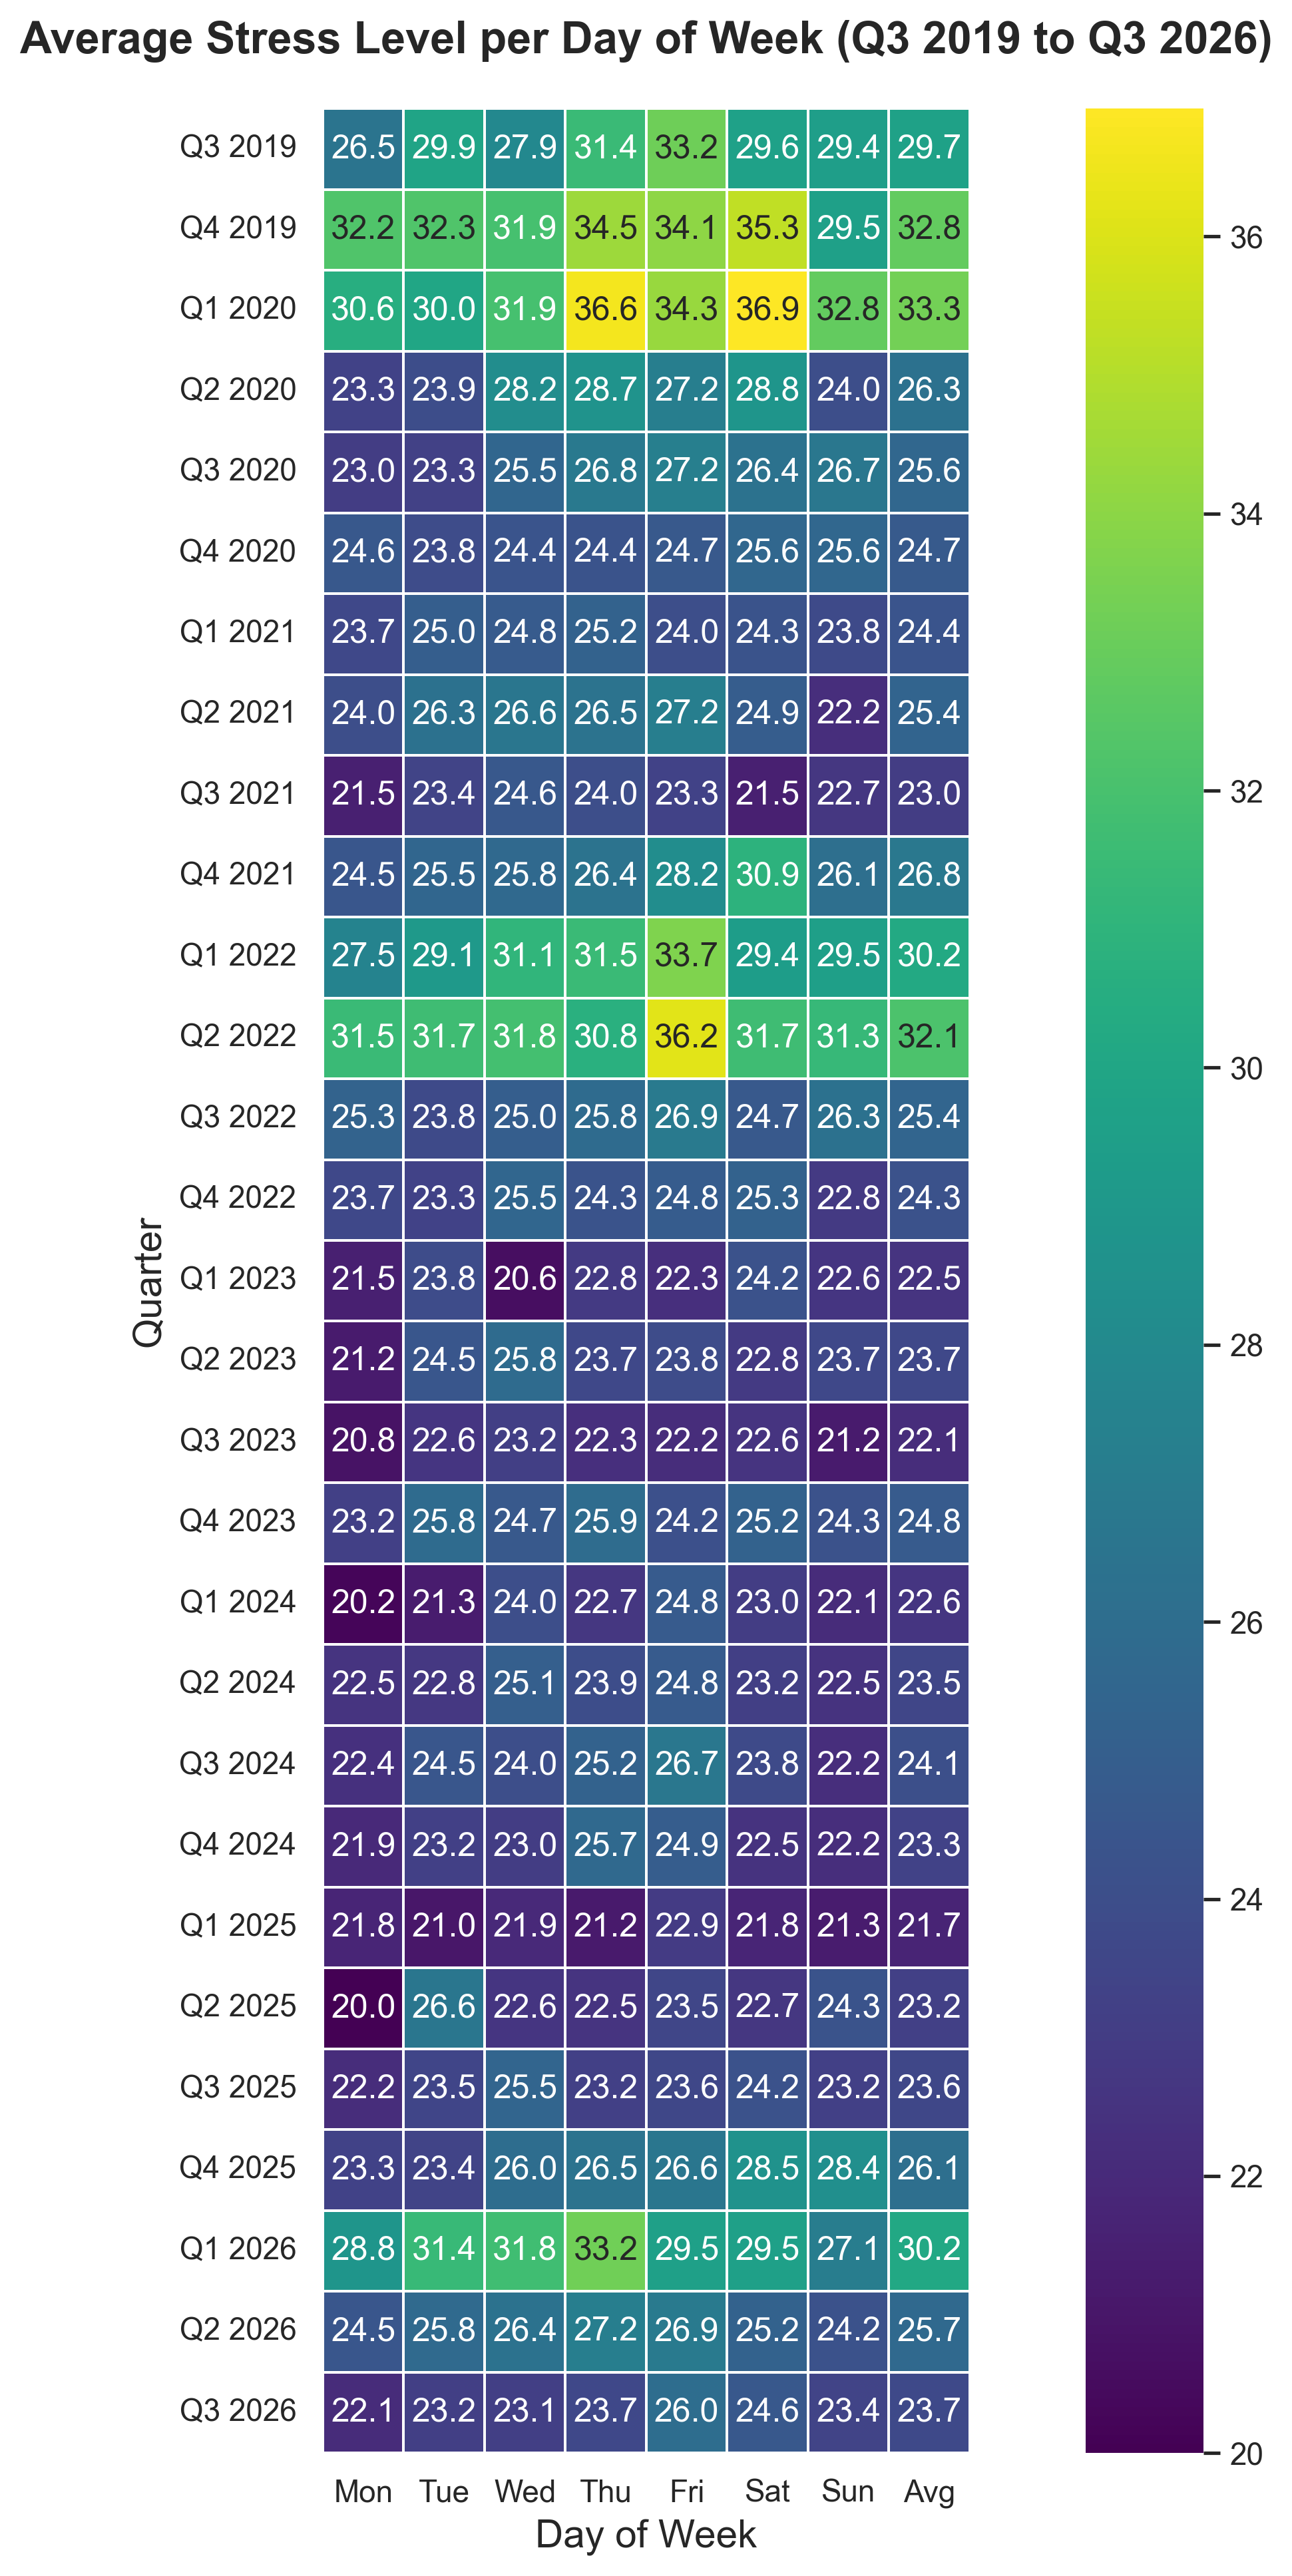
Average stress dropped from 25.9 in Q2 to 23.7 in Q3, across 92 daily records, and is now well below Q1’s 30.2.
Weekly stress trend:
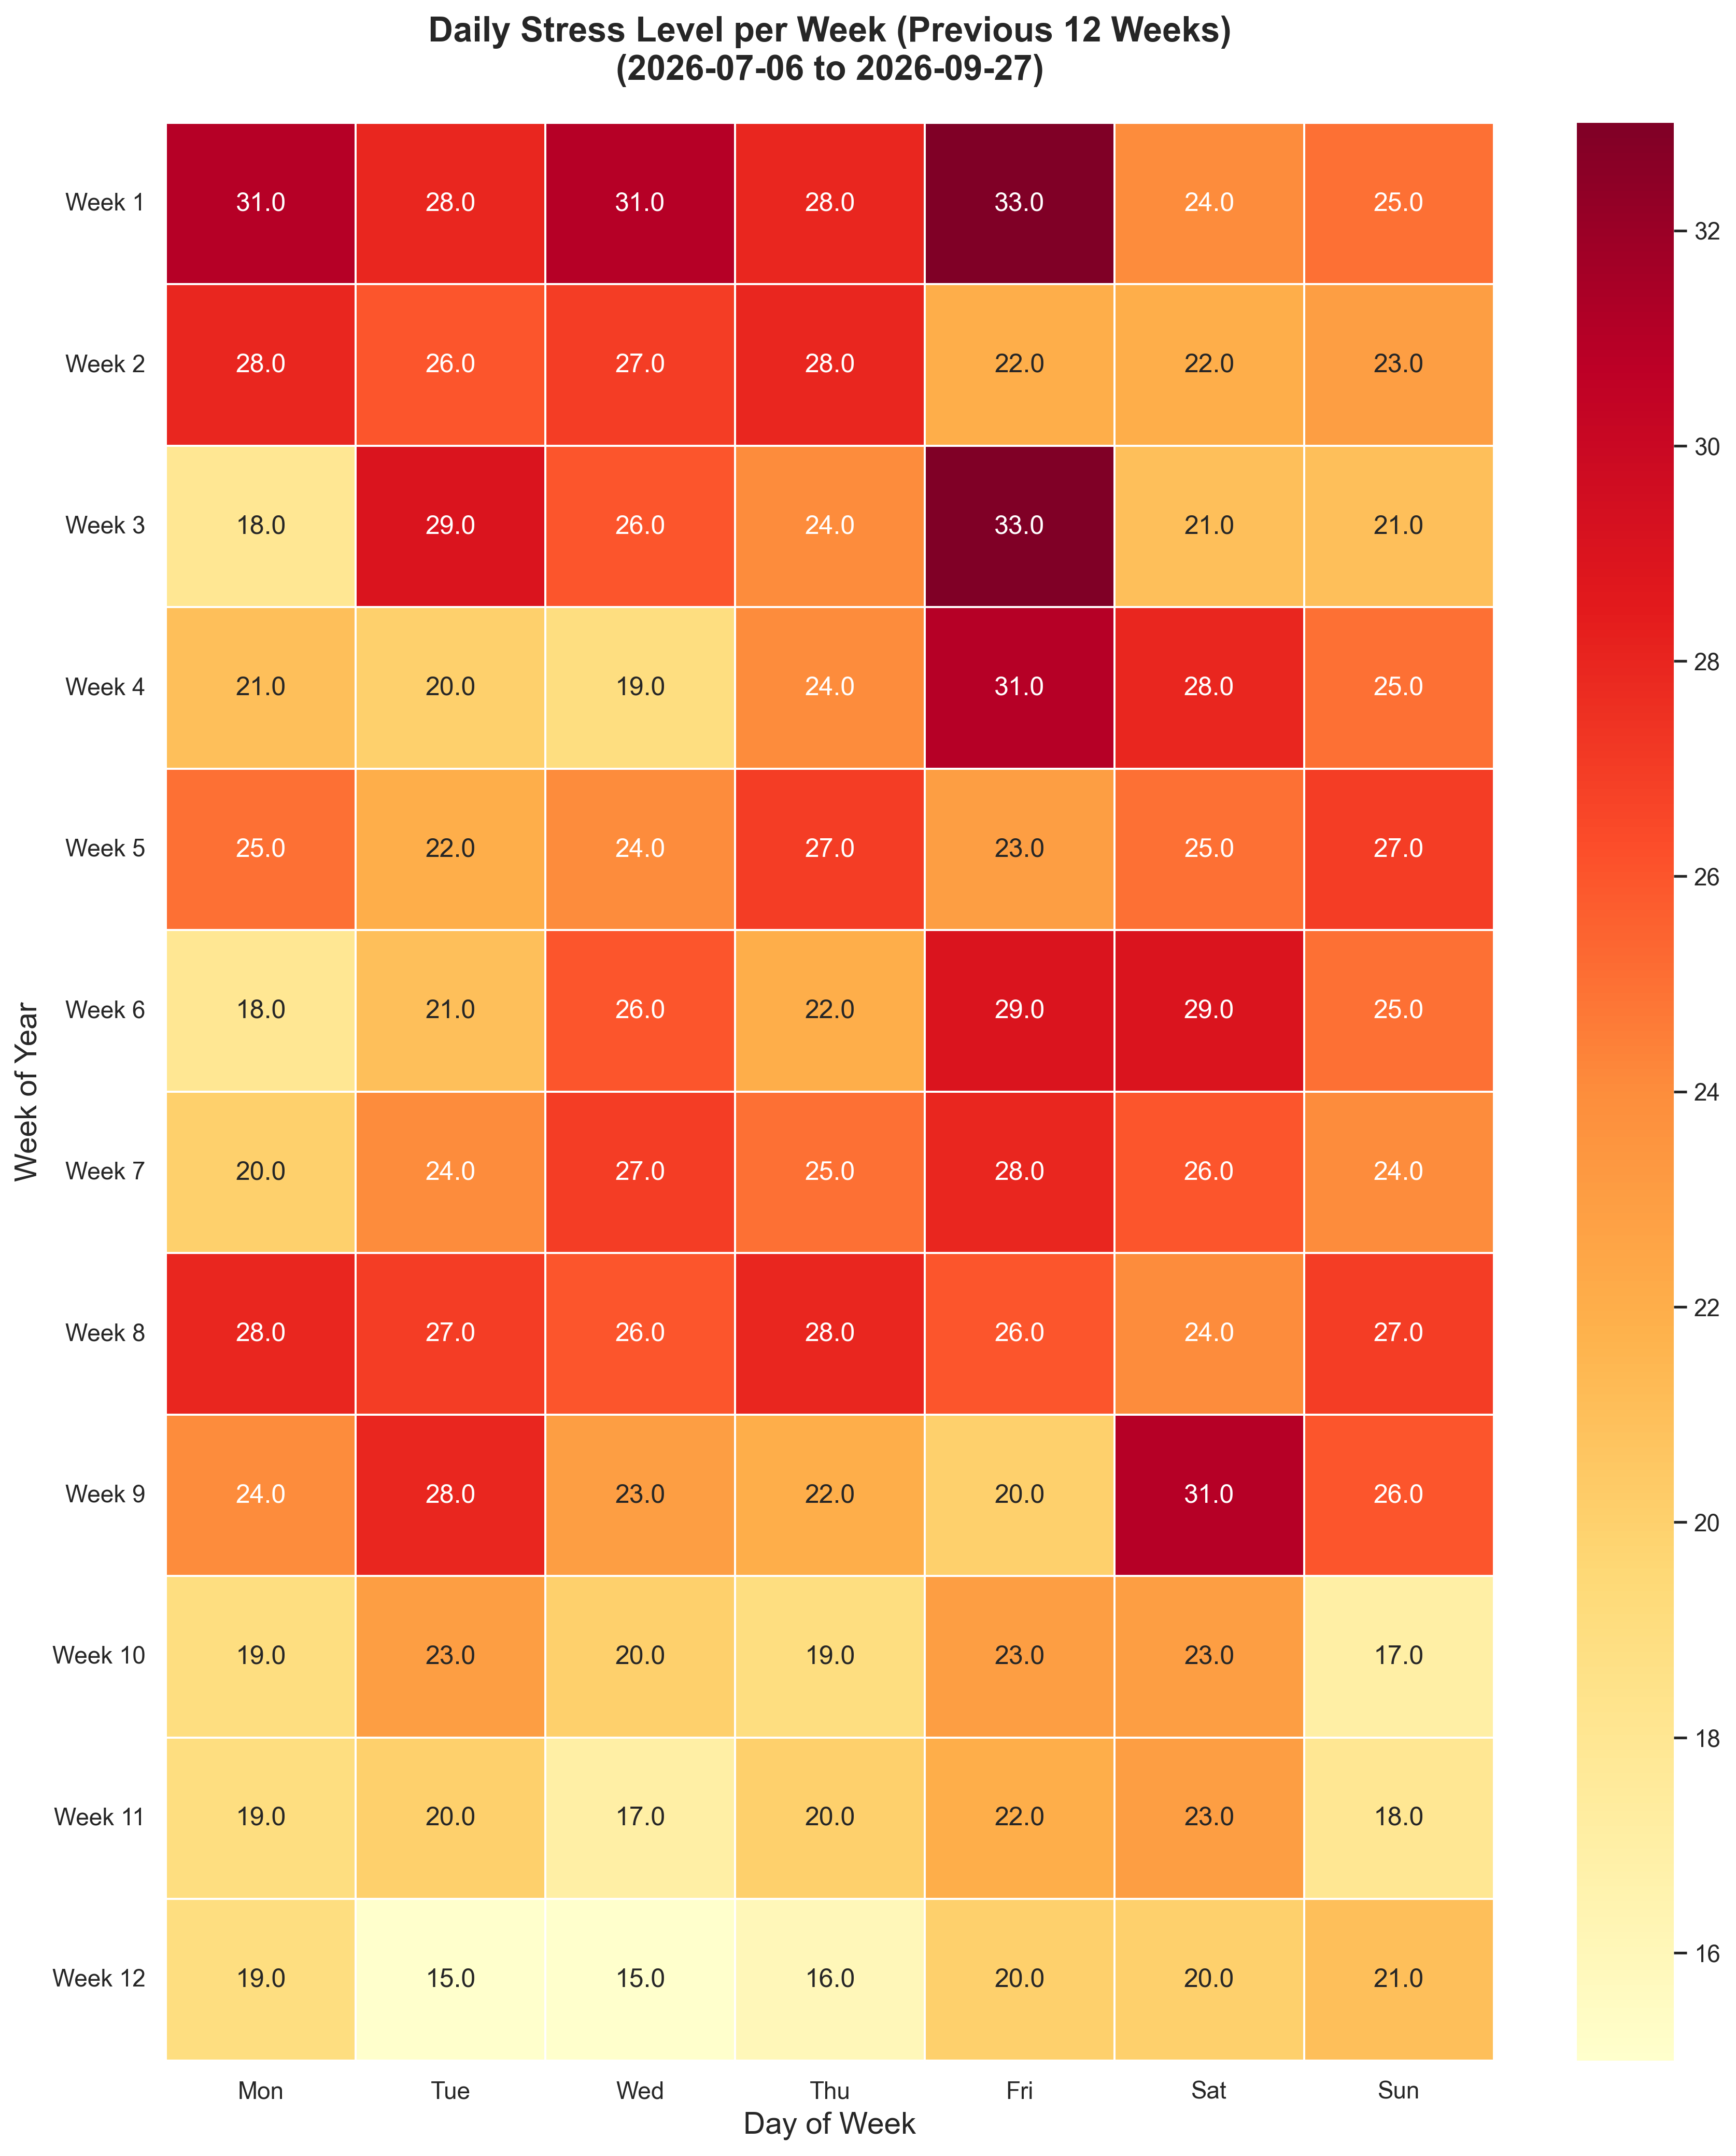
Monthly stress was 25.4 in July, 25.2 in August, and 20.4 in September, so most of the improvement came in the last month. By day of week, Friday was highest (25.9) and Monday lowest (22.0). The Thursday and Friday mid-to-late week peak from Q2 has softened, though Friday is still the most stressful day.
Experiments
Even without looking at data I can see the relationship between exercise and measured stress level: after a few days of running my watch stress levels " turn blue".
One thing I’m going to keep an eye out for his my showers. I’m seeing a trend where when I have longer super hot showers then my stress levels stay up for quite some time.
Improve Biomarkers
Goals
- Decrease IGF-1 ❓
- Decrease MCV ✅
- Decrease Fasting Glucose ✅
- Decrease RDW ⚠️
- Increase Albumin ⚠️
- Maintain hsCRP ✅
Analysis
I had two blood draws around this quarter: a partial panel on July 31, 2026, and a full follow-up on October 1, 2026, the day after quarter end. The October results are the latest for most markers, so the table compares them against the most recent prior result. IGF-1 was not run in either draw.
| Biomarker | Prior | Latest | Trend | Status |
|---|---|---|---|---|
| IGF-1 | 35 nmol/L (2025-10-10) | Not retested | No update | Previously above range |
| MCV | 95 fL (2026-04-22) | 92 fL (2026-10-01) | Decreased (90 on 07-31) | In range |
| Glucose | 5.4 mmol/L (2026-04-22) | 5.3 mmol/L (2026-10-01) | Decreased slightly | In range, fasting |
| RDW | 12.8% (2026-04-22) | 12.7% (2026-10-01) | Flat | In range |
| Albumin | 45 g/L (2026-01-17) | 42 g/L (2026-10-01) | Decreased (41 on 07-31) | In range, below January |
| hsCRP | <0.2 mg/L (2026-04-22) | 0.2 mg/L (2026-10-01) | Stable | Low risk (< 1.0) |
| Ferritin | 36 ug/L (2026-07-31) | 23 ug/L (2026-10-01) | Decreased | Below range, flagged low by the lab |
| Red cell count | 4.38 x10¹²/L (2026-07-31) | 4.33 x10¹²/L (2026-10-01) | Flat | Below range, flagged low by the lab |
| Creatine kinase | 111 U/L (2026-01-17) | 259 U/L (2026-10-01) | Increased | Slightly above range (45 to 250) |
| Homocysteine | 9.9 µmol/L (2026-04-22) | 14.2 µmol/L (2026-07-31) | Increased, not rechecked | In range, near the upper limit |
| Vitamin B12 | 435 pmol/L (2025-10-10) | 208 pmol/L (2026-07-31) | Decreased, not rechecked | Lab flags indeterminate (150 to 260) |
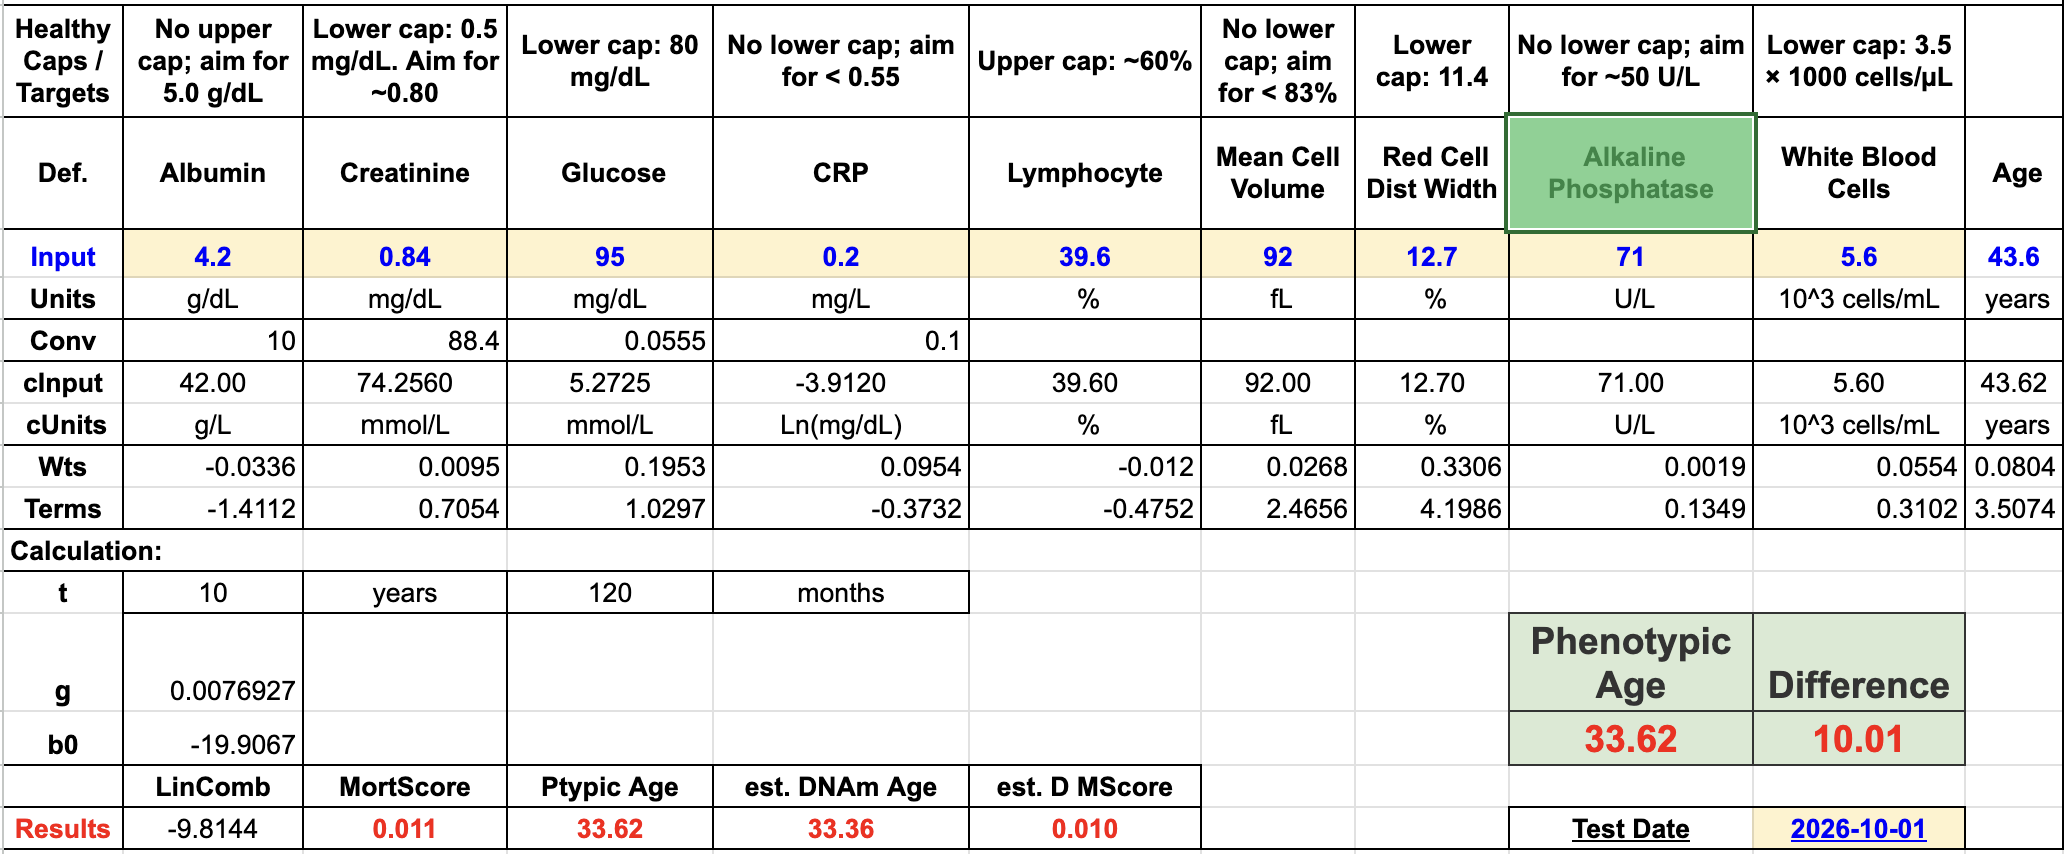
PhenoAge for October 1, 2026 came out at 33.62 against a chronological age of 43.6, a gap of 10.01 years. That is slightly better than July (34.0, gap 9.5) and close to April (32.34, gap 10.84).

Key interpretation:
- Wins: fasting glucose came down to 5.3, hsCRP stayed very low at 0.2, and MCV fell from 95 to 92 fL (it was 90 fL on July 31). RDW stayed flat and in range, and lipids look steady: LDL 2.4, HDL 1.6, triglycerides 0.6 mmol/L.
- Concerns: ferritin fell to 23 ug/L, below range, and the lab’s comment was that this is consistent with iron deficiency and to consider dietary causes before repeating the blood count. Iron saturation (20%) and iron (12.9 umol/L) are at the low end of normal. Red cell count remains just under range (4.33) and haematocrit is at the 0.40 lower limit. Creatine kinase was mildly high at 259 (flagged by the lab as a mild non-specific increase). Albumin is in range but below January’s 45.
- Follow-ups: retest IGF-1, and recheck B12 and homocysteine, which were last measured on July 31 (B12 208 pmol/L, homocysteine 14.2) and were not part of the October panel. The October albumin of 42 on a non-haemolysed sample suggests the 41 on July 31 was not a real drop.
Experiments
- The ferritin trend (45 in July 2025, 36 in July 2026, 23 now) together with low red cell count might point to the iron side of the stack.
- The glucose improvement is encouraging after the Q2 CGM experiment, but it is one fasting reading.
Improve Nutrition
Goals
- Keep fasting glucose below 5.4 mmol/L.
Analysis
Fasting glucose was 5.3 mmol/L on October 1, down from 5.4 in April. There was no new CGM data this quarter, so the CGM learnings from Q2 still stand: laksa, wonton noodle soup, GYG burritos, and airline food spiked my glucose, and walking afterwards helped less than I hoped.
Experiments
No nutrition experiments.
Supplement Stack
Some principles that I tried to follow:
- Avoid pill burden; prefer food over pills.
- Wait until a supplement is on the ITP supported interventions page, or has significant evidence behind it.
- Have a biomarker in mind that a certain supplement will change.
Current stack (carried forward from Q2, TODO: confirm it is still accurate):
| Morning | Evening | Ad Hoc |
|---|---|---|
| Vitamin D (5000 IU) | Glycine (10g) | Iron (20mg) |
| Vitamin K2 mk7 (100mcg) | NAC (1g) | Vitamin C (500mg) |
| B-complex / methylated B vitamins | Magnesium | |
| Zinc (15mg) | ||
| Hyaluronic Acid (200mg) | ||
| Iodine (150mcg) | ||
| Creatine (5g - in smoothie) | ||
| TMG (1.5g - in smoothie) | ||
| Boron (1mg - in smoothie) | ||
| Taurine (3g - in smoothie) | ||
| Omega-3 (1g EPA, 750mg DHA) |
Experiments
- Vitamin D looks well covered (101 nmol/L on July 31), which is a reasonable argument for not increasing it.
- Ferritin dropped to 23 ug/L in October, so I want to revisit the ad hoc iron (20mg).
Focus For Next Quarter
General
- Keep increasing my iron intake
- Keep late night work to a minimum. I’m also contemplating a light bar under my monitor.
- Consistency consistency consistency. This will be relatively challenging as I’ve got multiple work trips planned over the upcoming months.
- Keep average sleep score above 80, with a closer look at my Friday and Saturday nights.
Exercise
- Hold weekly intensity at or above 800 minutes, which the last four full weeks of Q3 reached.
- Get VO2 max above 50; it finished the quarter at 49.
- Keep strength training at roughly three sessions per week, as in Q3.
Wish me luck!