2026 Q2 Health Review
Reflection
Q2 2026 was a better recovery quarter than Q1: stress dropped, body battery improved, steps came back up, active calories increased, and VO2 max started to recover.
It was not a clean win. Sleep stayed just under target, May had a noticeable dip, and weekly intensity was still well below the 800-minute goal. But after the injury-disrupted Q1, this looks like movement in the right direction rather than another quarter of drift.
Focus Areas
As usual, there are five areas that I wanted to focus on:
- Improve fitness by rebuilding training volume and getting back toward consistent weekly load.
- Sleep better by improving sleep hygiene and meal timing.
- Reduce stress by reinforcing daily recovery habits.
- Improve biomarkers by focusing on measurable lab outcomes.
- Improve nutrition by using food choices to support glucose, recovery, and biomarkers.
Overall quarter snapshot:
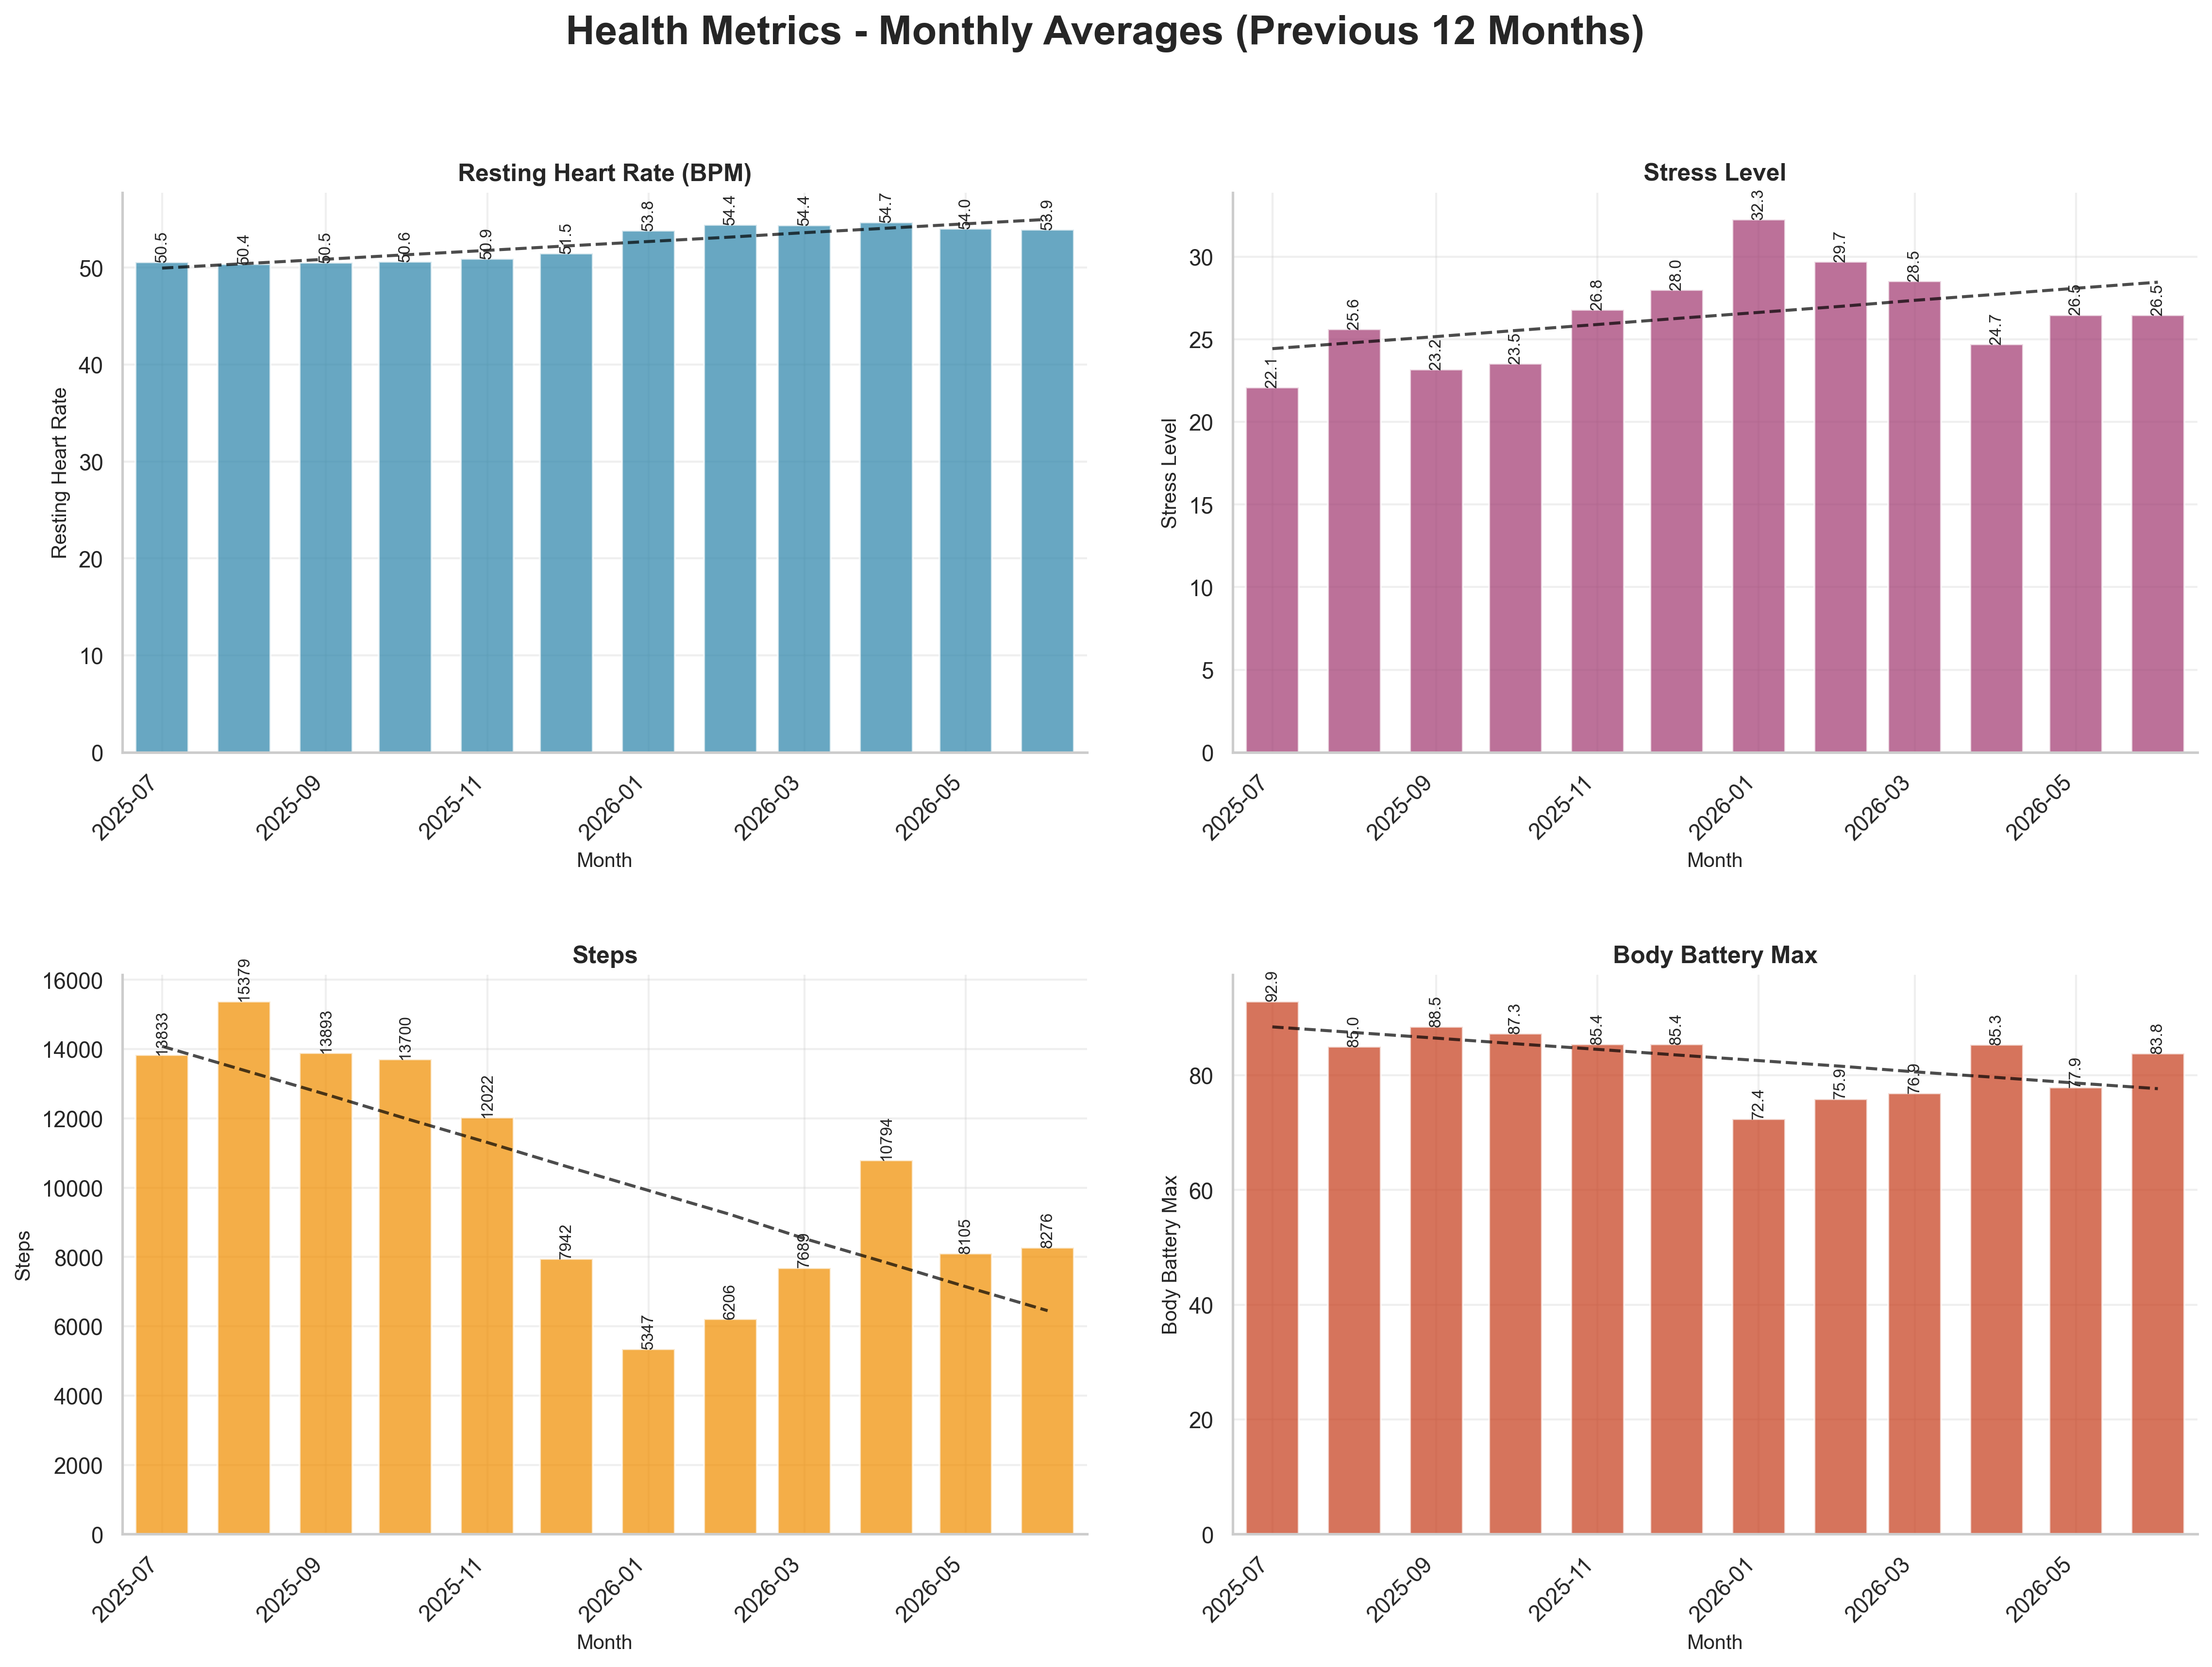
Data coverage note: LifeDB synced successfully on July 11, 2026, with Garmin data available beyond the end of Q2. The Q2 Garmin analysis below uses daily-summary records from April 1 through June 30, 2026, plus 88 scored sleep nights.
Quarter-over-quarter highlights:
- Average stress fell from 30.2 in Q1 to 25.9 in Q2, based on 89 Q2 daily-summary records.
- Average max body battery rose from 75.0 in Q1 to 82.4 in Q2.
- Average daily steps rose from 6,421 in Q1 to 9,069 in Q2.
- Average active calories rose from 363 in Q1 to 520 in Q2.
- Average resting heart rate was flat at 54.2 bpm in both Q1 and Q2.
- Average sleep score was essentially flat: 79.5 in Q1 vs 79.2 in Q2, across 88 scored Q2 nights.
- Average daily intensity rose from 35.6 to 72.2 intensity minutes, but that still was not enough to hit the weekly target.
Correlations for the quarter:
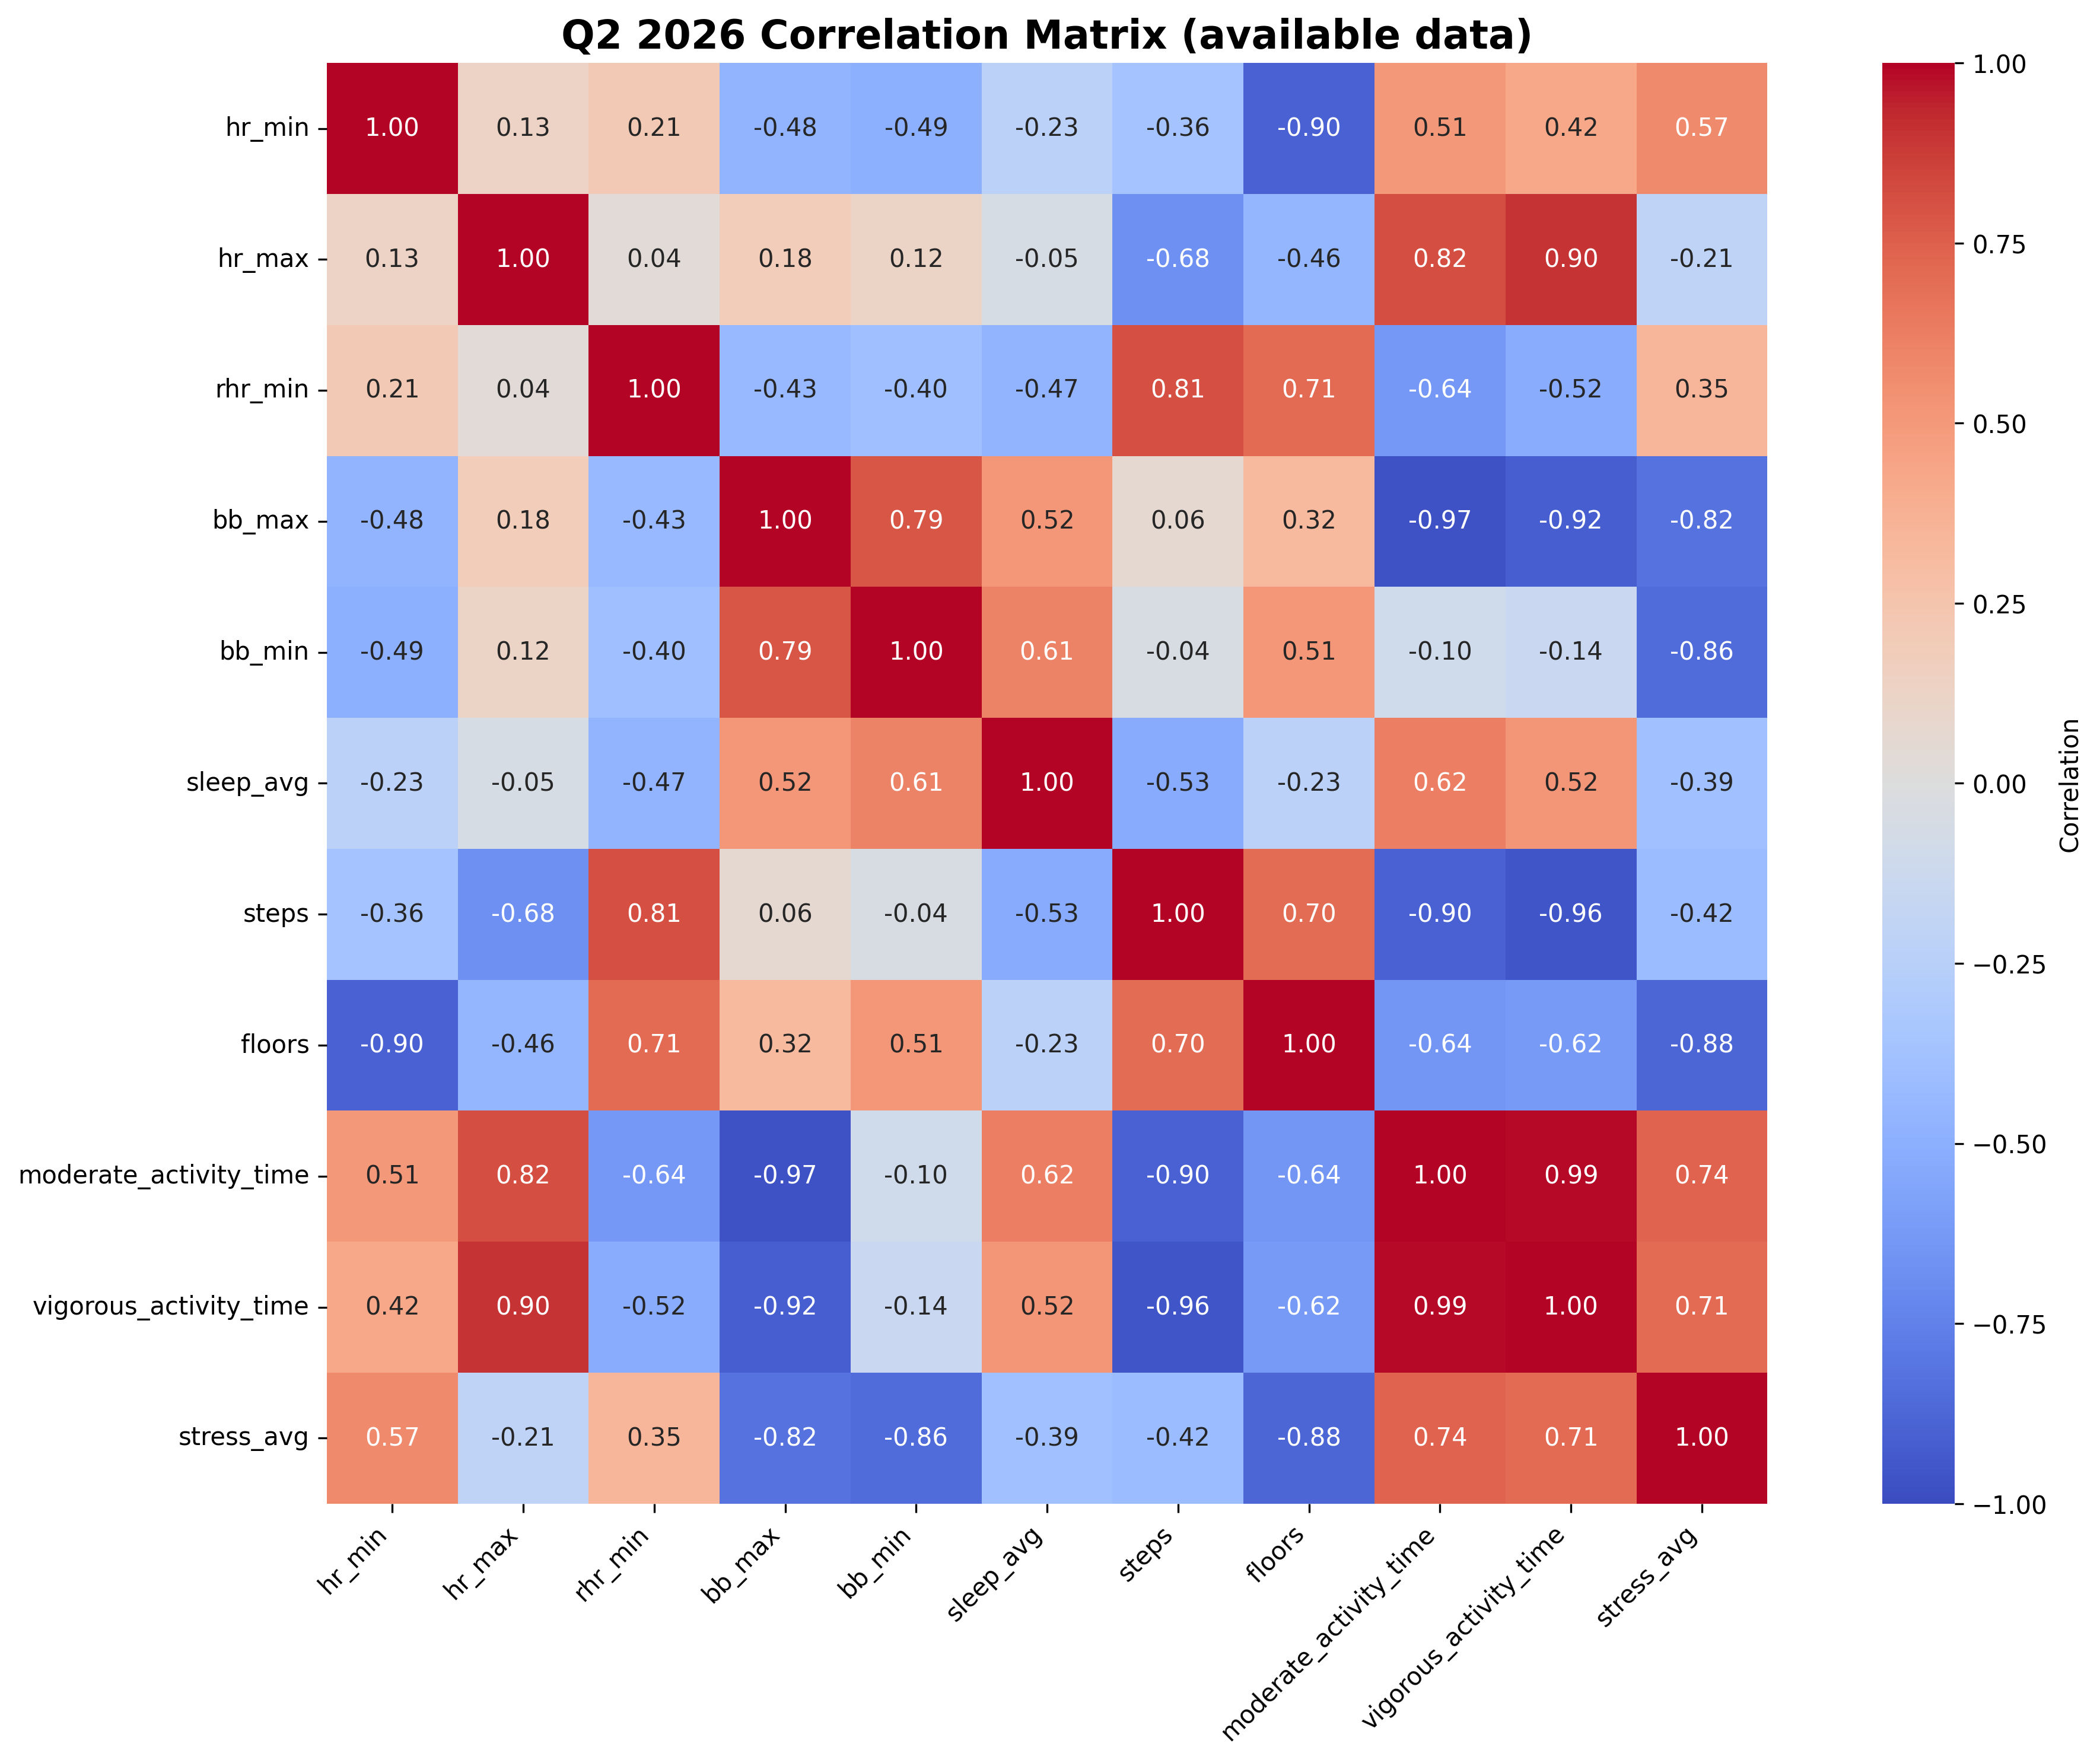
The broad pattern is what I would expect: activity and output metrics cluster together, and stress still sits opposite recovery. The most useful practical signal is not exotic: higher-stress weeks were the weeks where body battery recovery looked more fragile, and the better activity weeks tended to line up with higher active calories and steps.
Let us go through how the quarter looked by focus area.
Improve Fitness
Goals
- Average intensity minutes (Garmin) of 800 or above ❌
- Improve Vo2Max ⚠️
- Decrease RHR ⚠️
Analysis
I look at intensity minutes as a way to make sure I am getting enough fitness, regardless of whether I am running, at the gym, or kayaking.
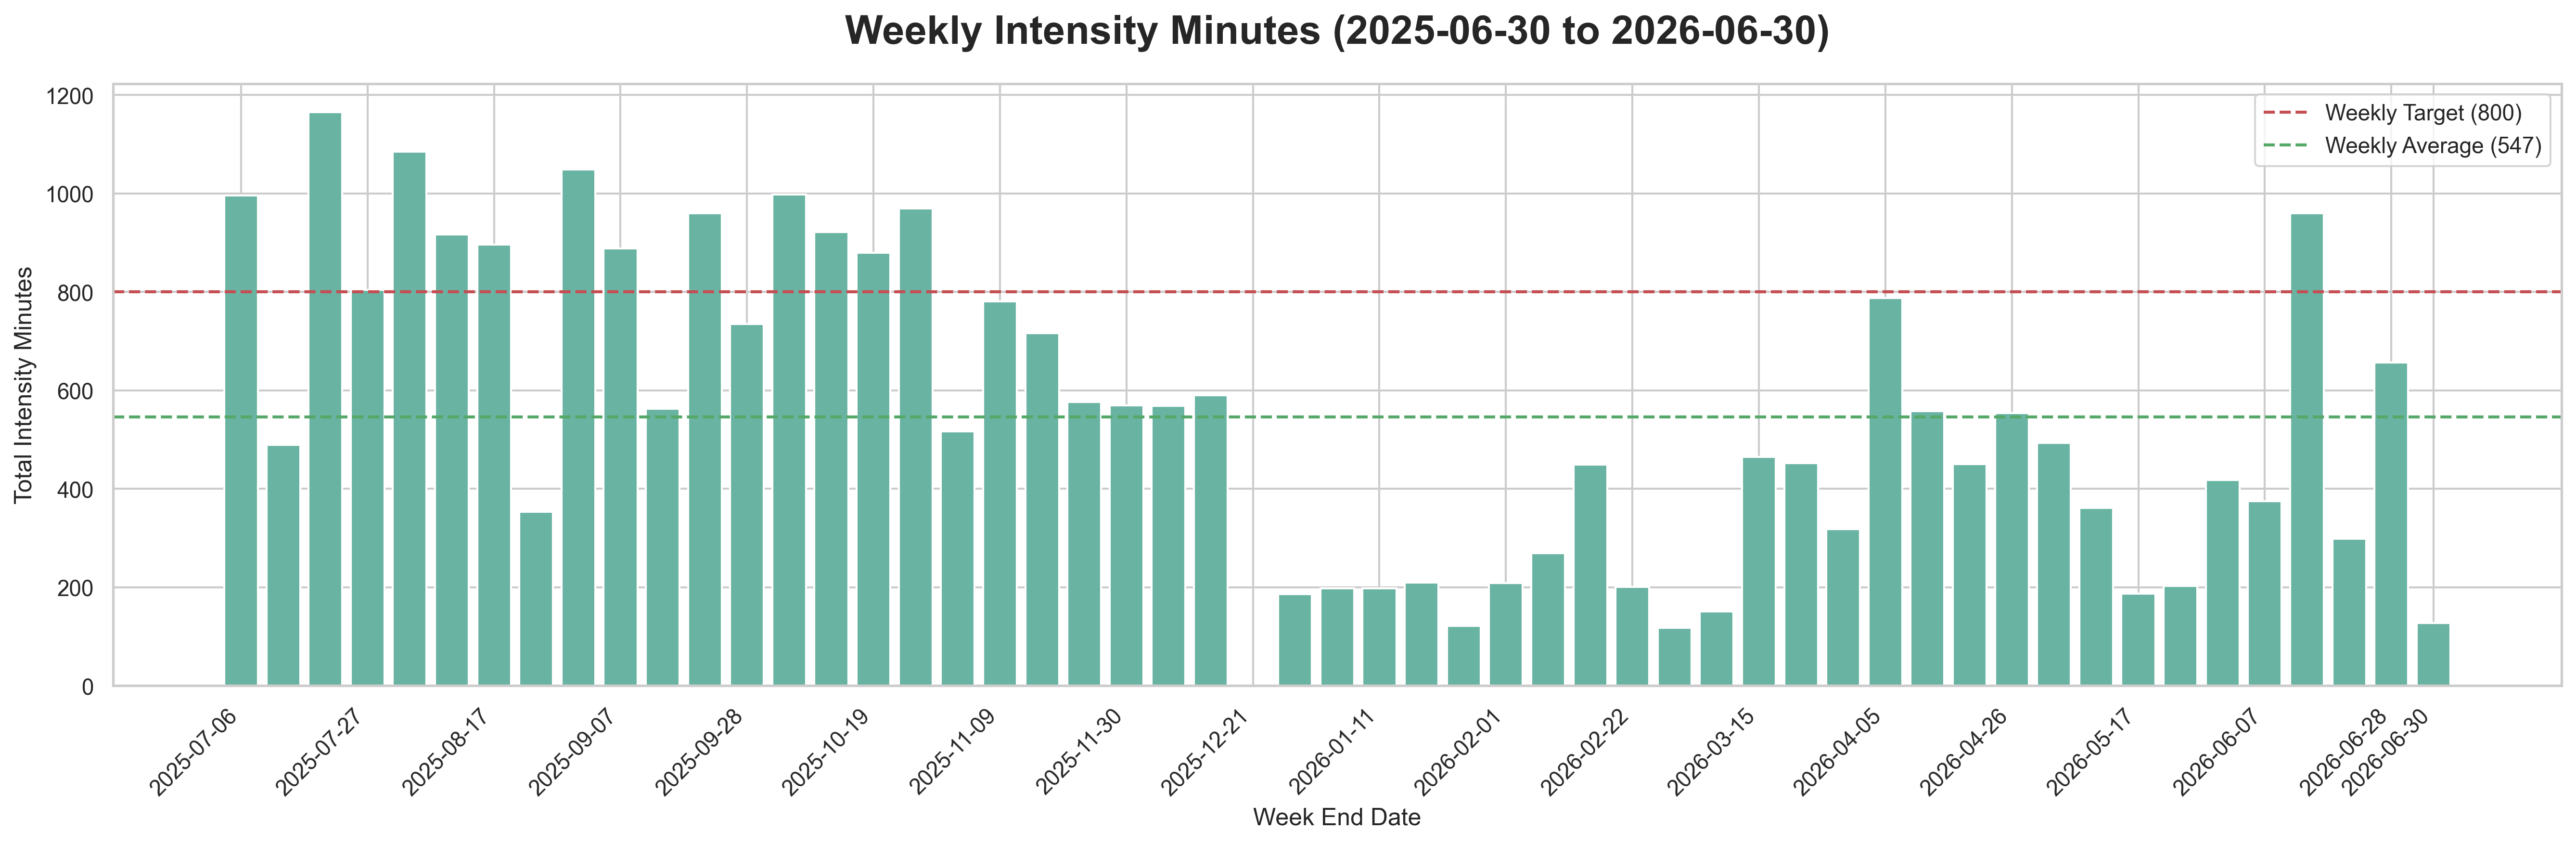
Q2 was a real improvement from Q1, but still below the target:
- Weeks counted: 14 week-ending buckets
- Average weekly intensity minutes: 459.4
- Median weekly intensity minutes: 434.0
- Weeks at or above 800 minutes: 1 of 14
- Best week: 960 minutes, week ending June 14
- Lowest week: 128 minutes, week ending June 30, because it only contains the final two Q2 days
That is much better than Q1’s very low training load, but it is still a long way from the 800-minute goal. April started strongly, May dipped, and June had one very big week before settling back down.
Resting heart rate is more complete:
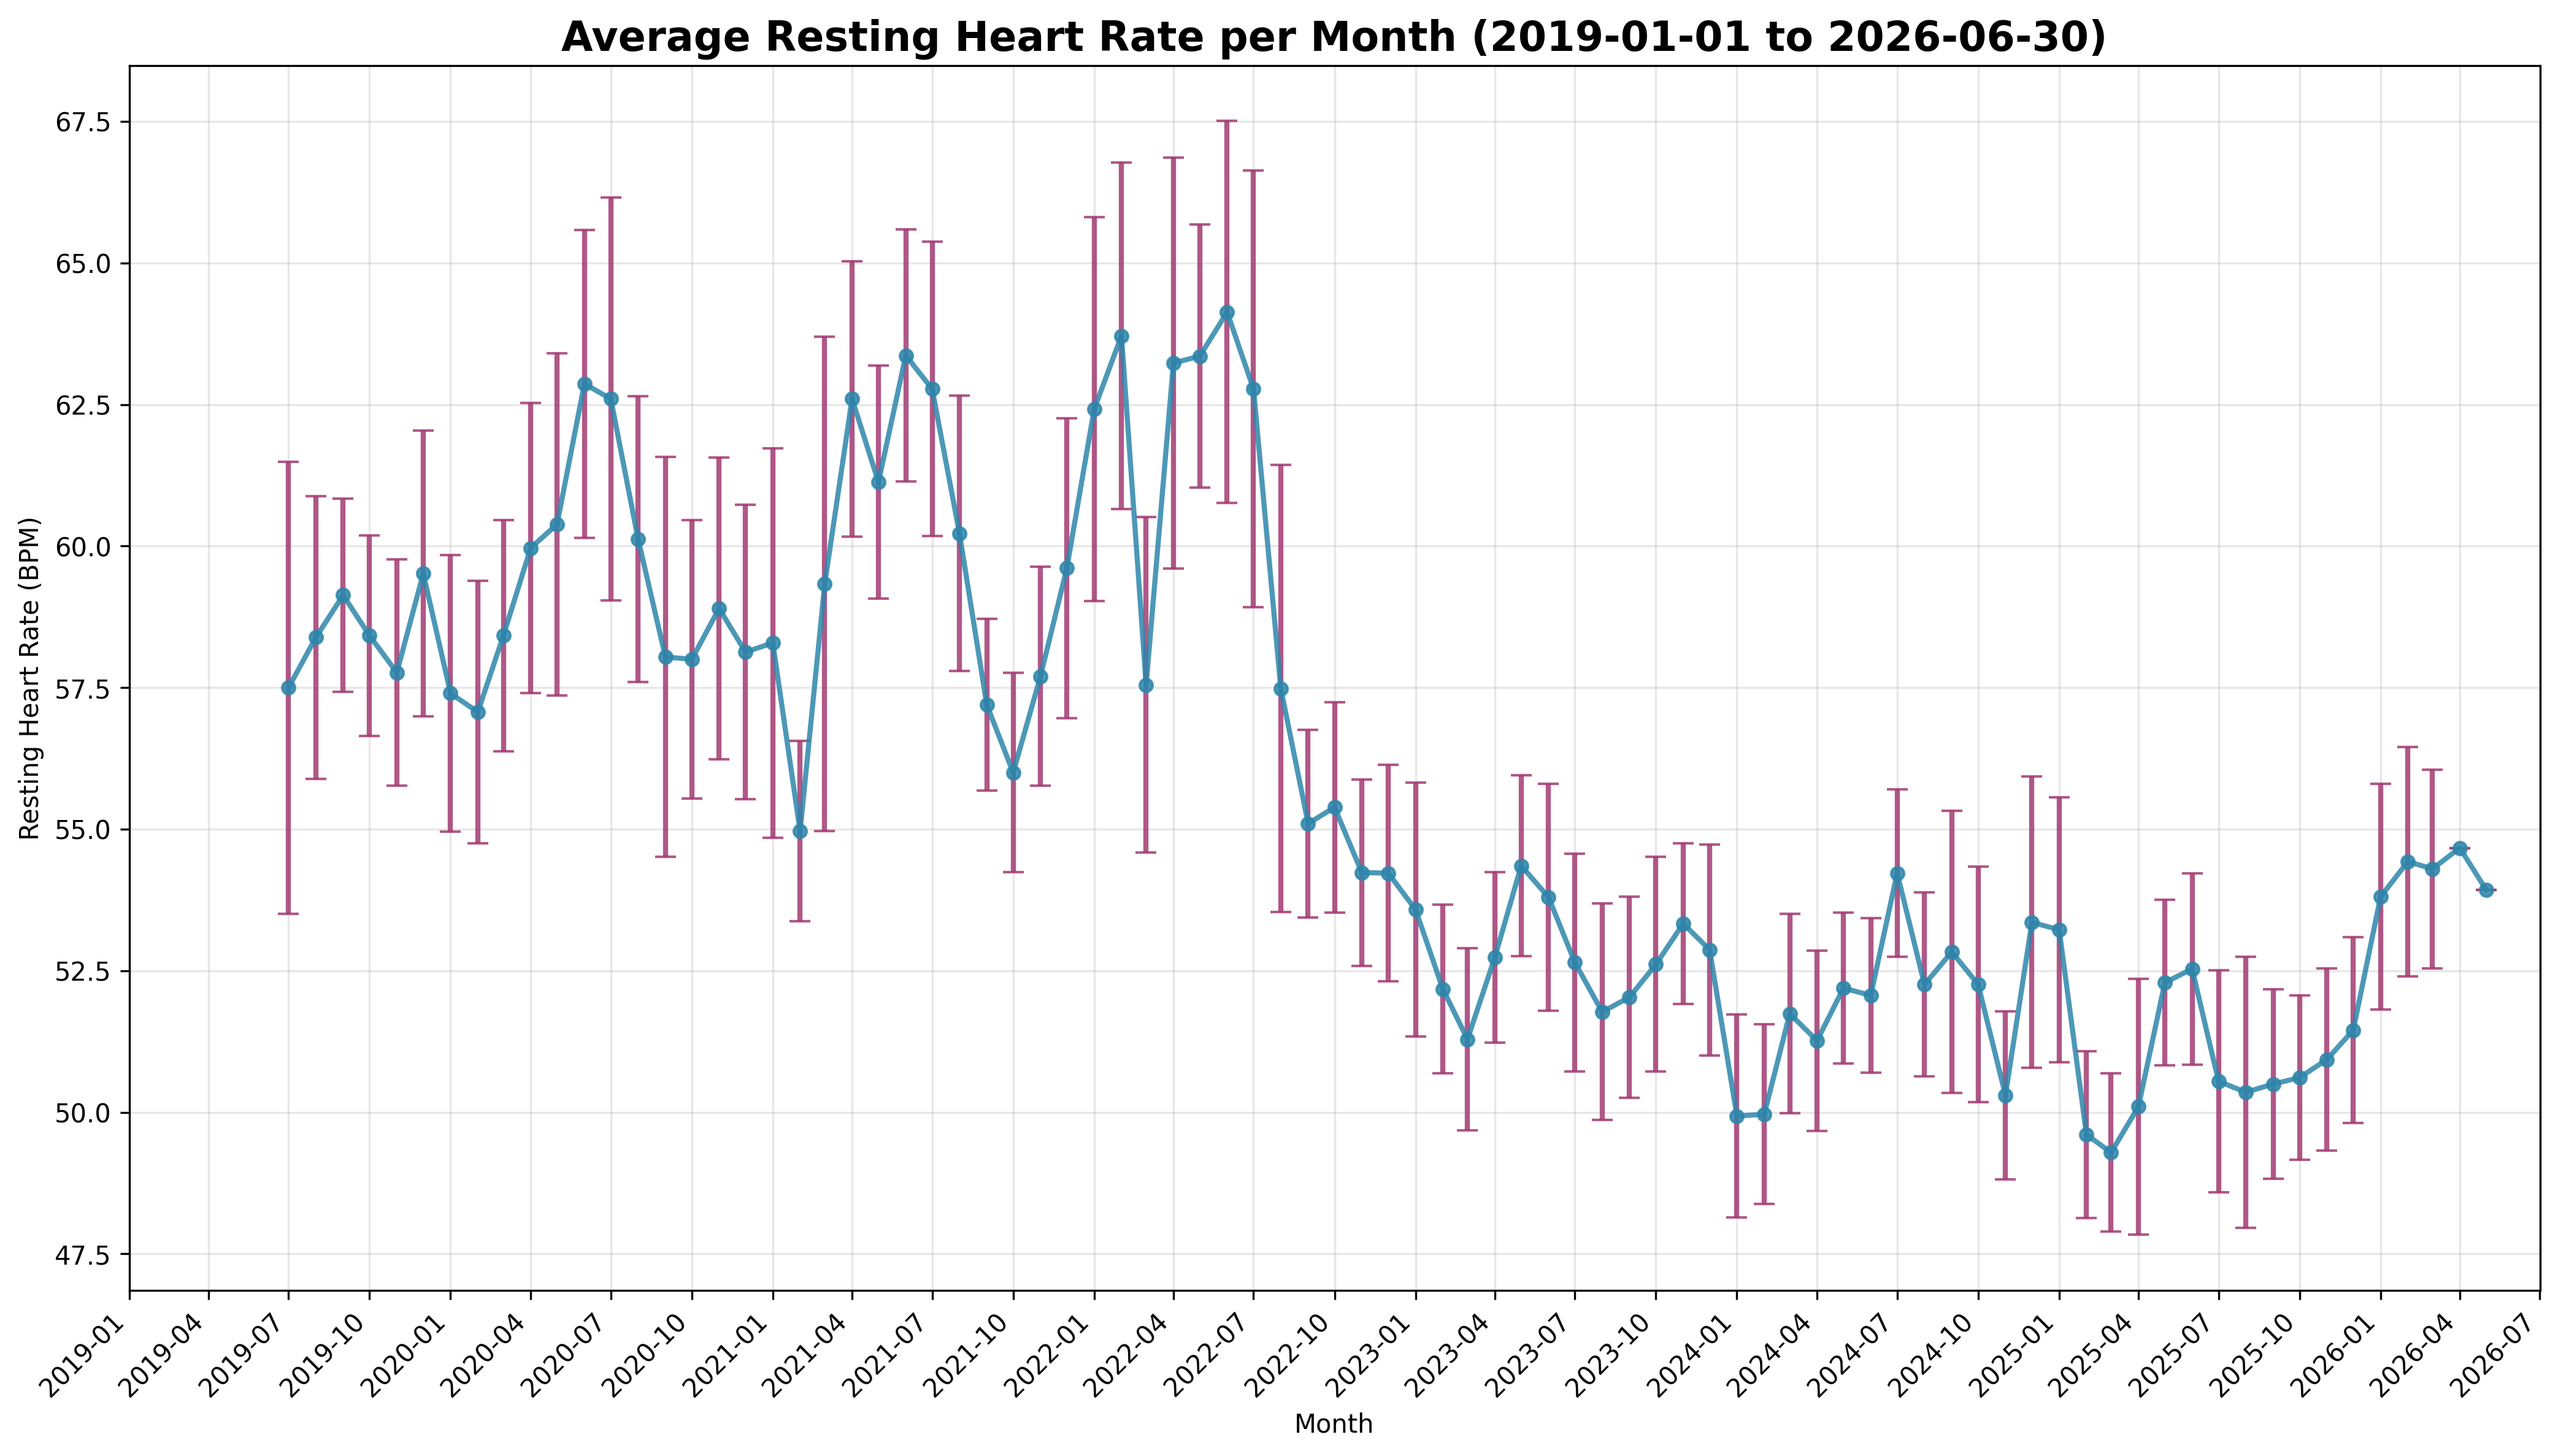
Average RHR was 54.2 bpm, exactly flat against Q1. Monthly RHR moved from 54.7 in April to 54.0 in May and 53.9 in June, so there is a small positive slope inside the quarter even though the quarter average did not improve.
VO2 max came back onto the board with 13 readings between April 10 and June 27:
- Minimum: 46
- Maximum: 48
- Average: 46.8
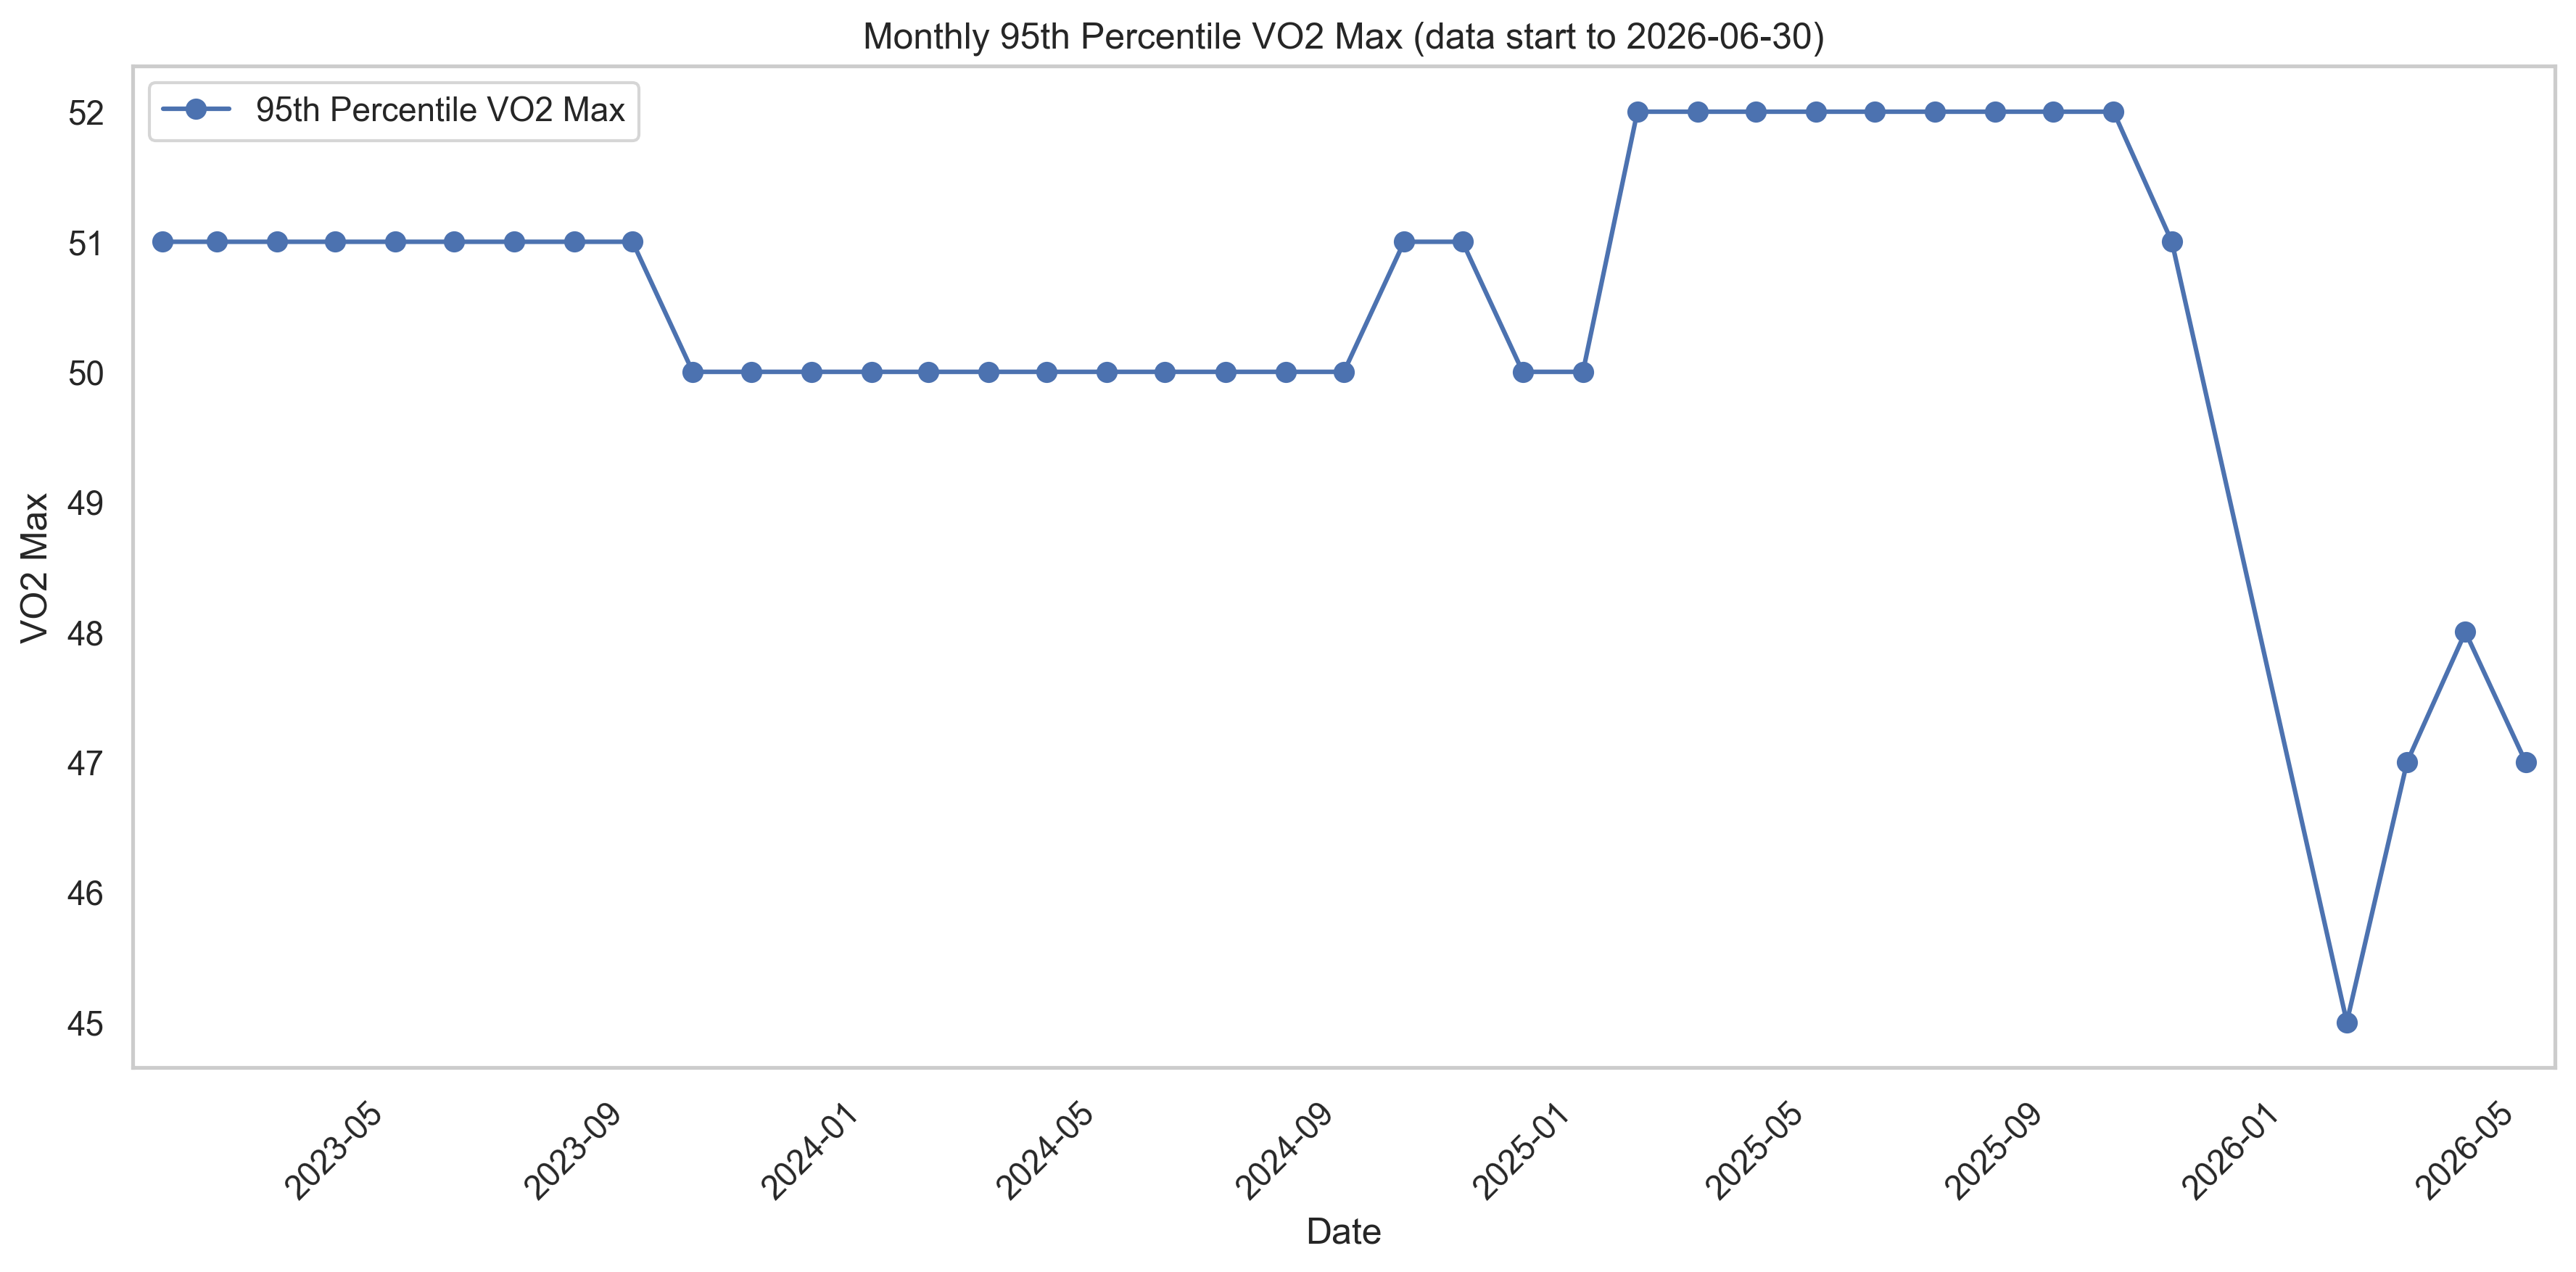
That is still below late-2025 levels, but it improved from the Q1 readings around 45 and gives me a usable baseline for Q3.
The activity mix also looked more alive again: LifeDB found 52 Q2 activities, led by walking, fitness equipment, running, and hiking.
Experiments
The Q1 plan was to rebuild training volume with a more structured running and strength schedule. The data suggests I did rebuild, but not consistently enough yet. The Q3 experiment should be less about finding the perfect schedule and more about making the ordinary weeks repeatable.
Improve Sleep
Goals
- Keep average sleep score about 80 ⚠️
Analysis
Sleep stayed close to target, but just under where I want it.
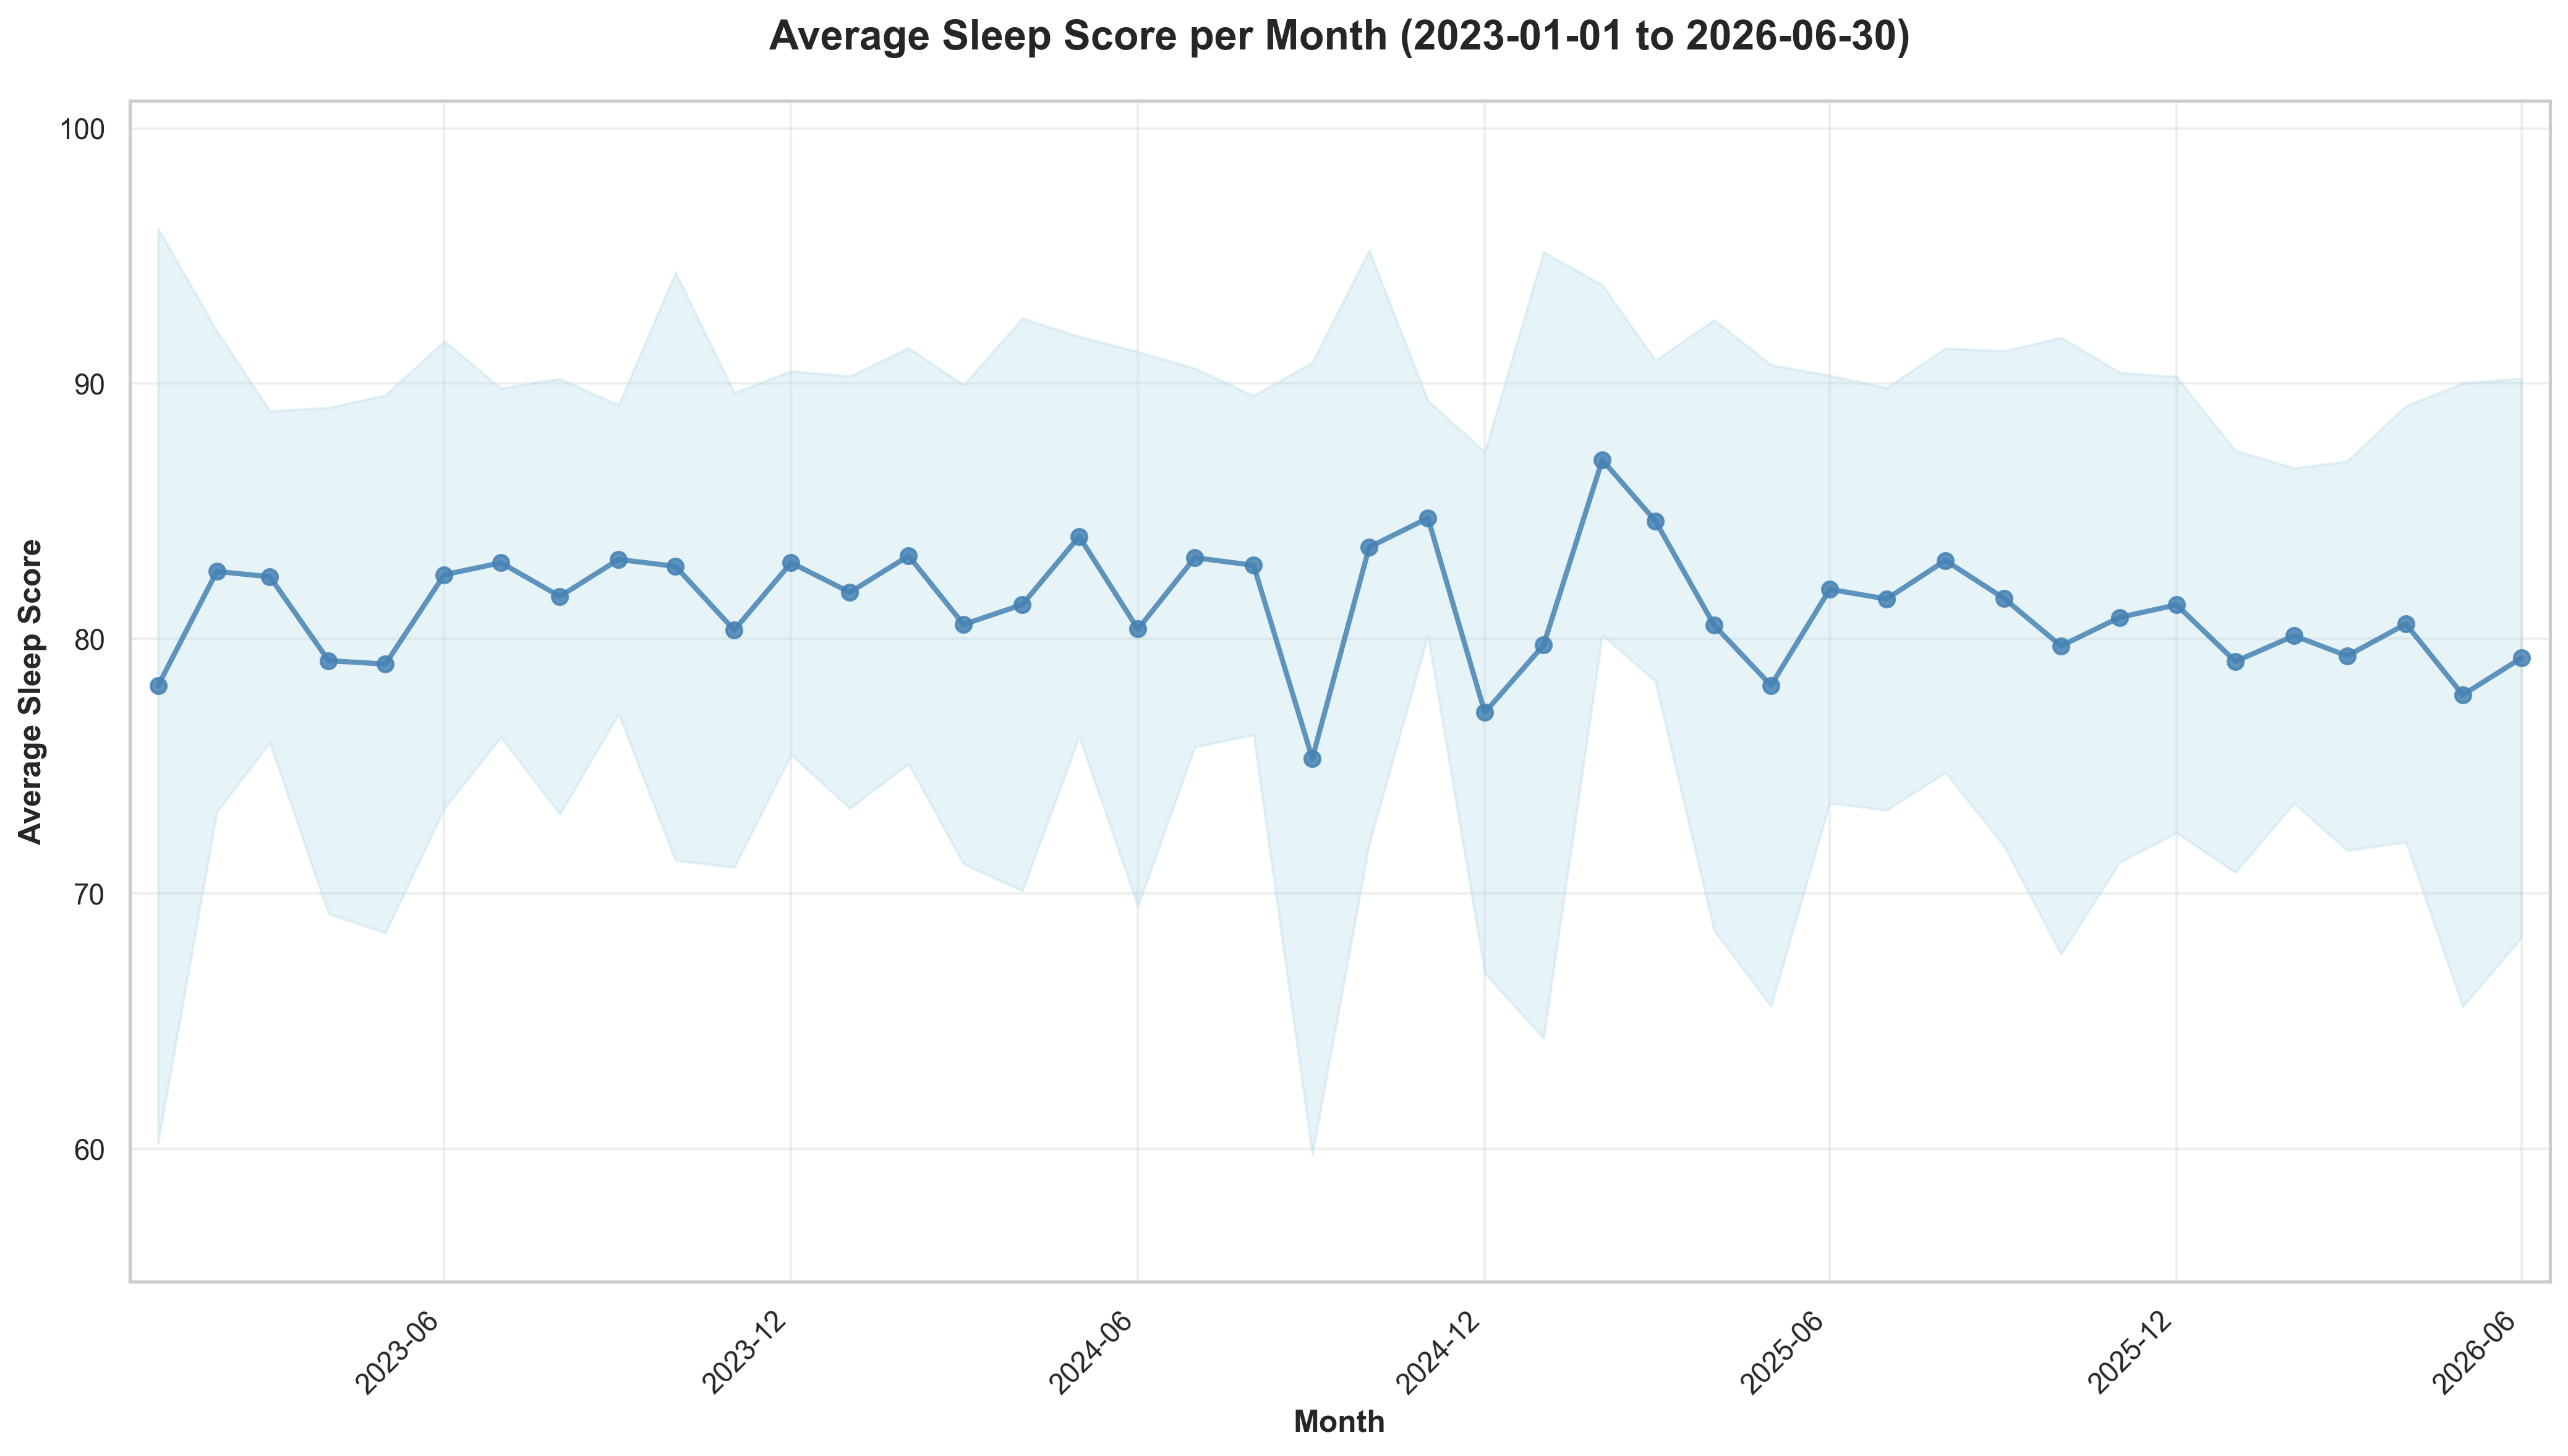
For Q2:
- Nights with sleep-score data: 88
- Average sleep score: 79.2
- Average sleep duration: 7.43 hours
- Q1 comparison: 79.5 average sleep score and 7.27 hours average sleep duration
Monthly sleep score was 80.6 in April, 77.8 in May, and 79.2 in June. That makes May the main weak patch of the quarter.
Day-of-week sleep pattern:
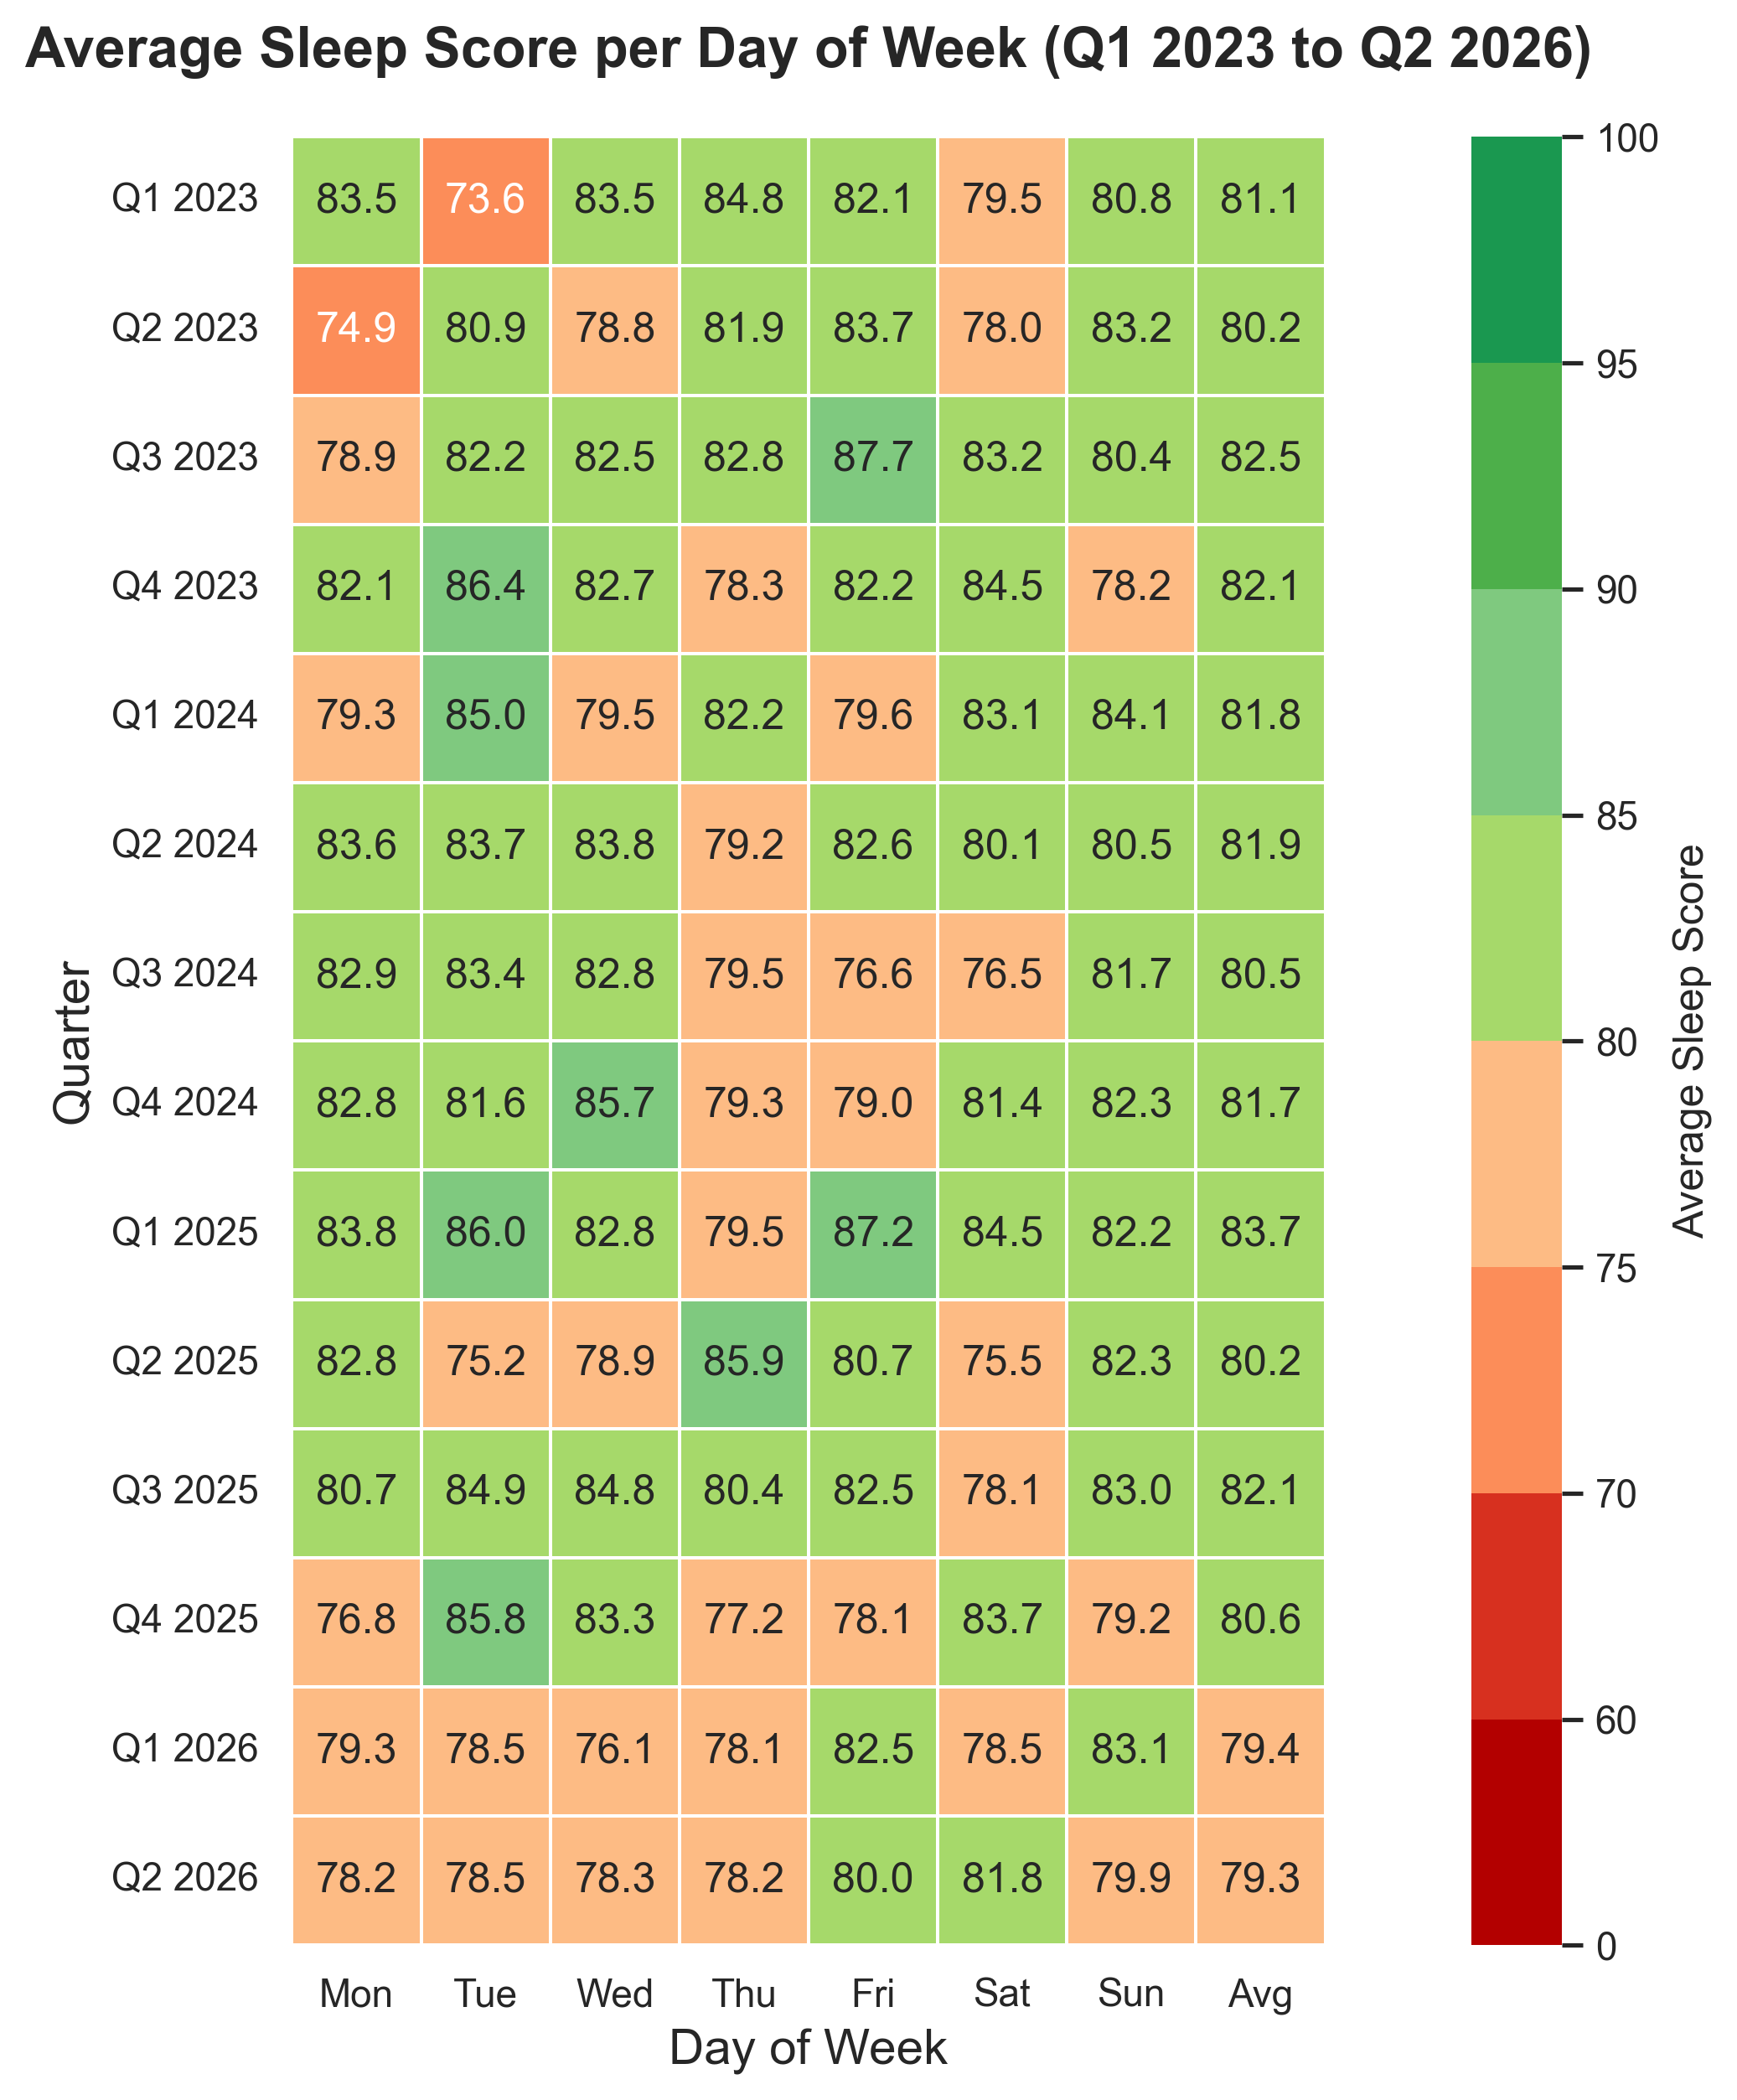
The strongest sleep-score days were Saturday (81.8, 12 nights) and Friday (80.0, 13 nights). The weakest were Monday and Thursday, both 78.2. The day-of-week spread is not enormous, but the work-week pattern is still visible.
Experiments
The main practical sleep question remains meal timing and evening routine. The numbers say I am close to target, but not reliably above it. That means Q3 should focus on consistency rather than a new complicated intervention.
Decrease Stress
Goals
- Decrease stress ✅
Analysis
Stress is the clearest improvement in the Q2 Garmin data.
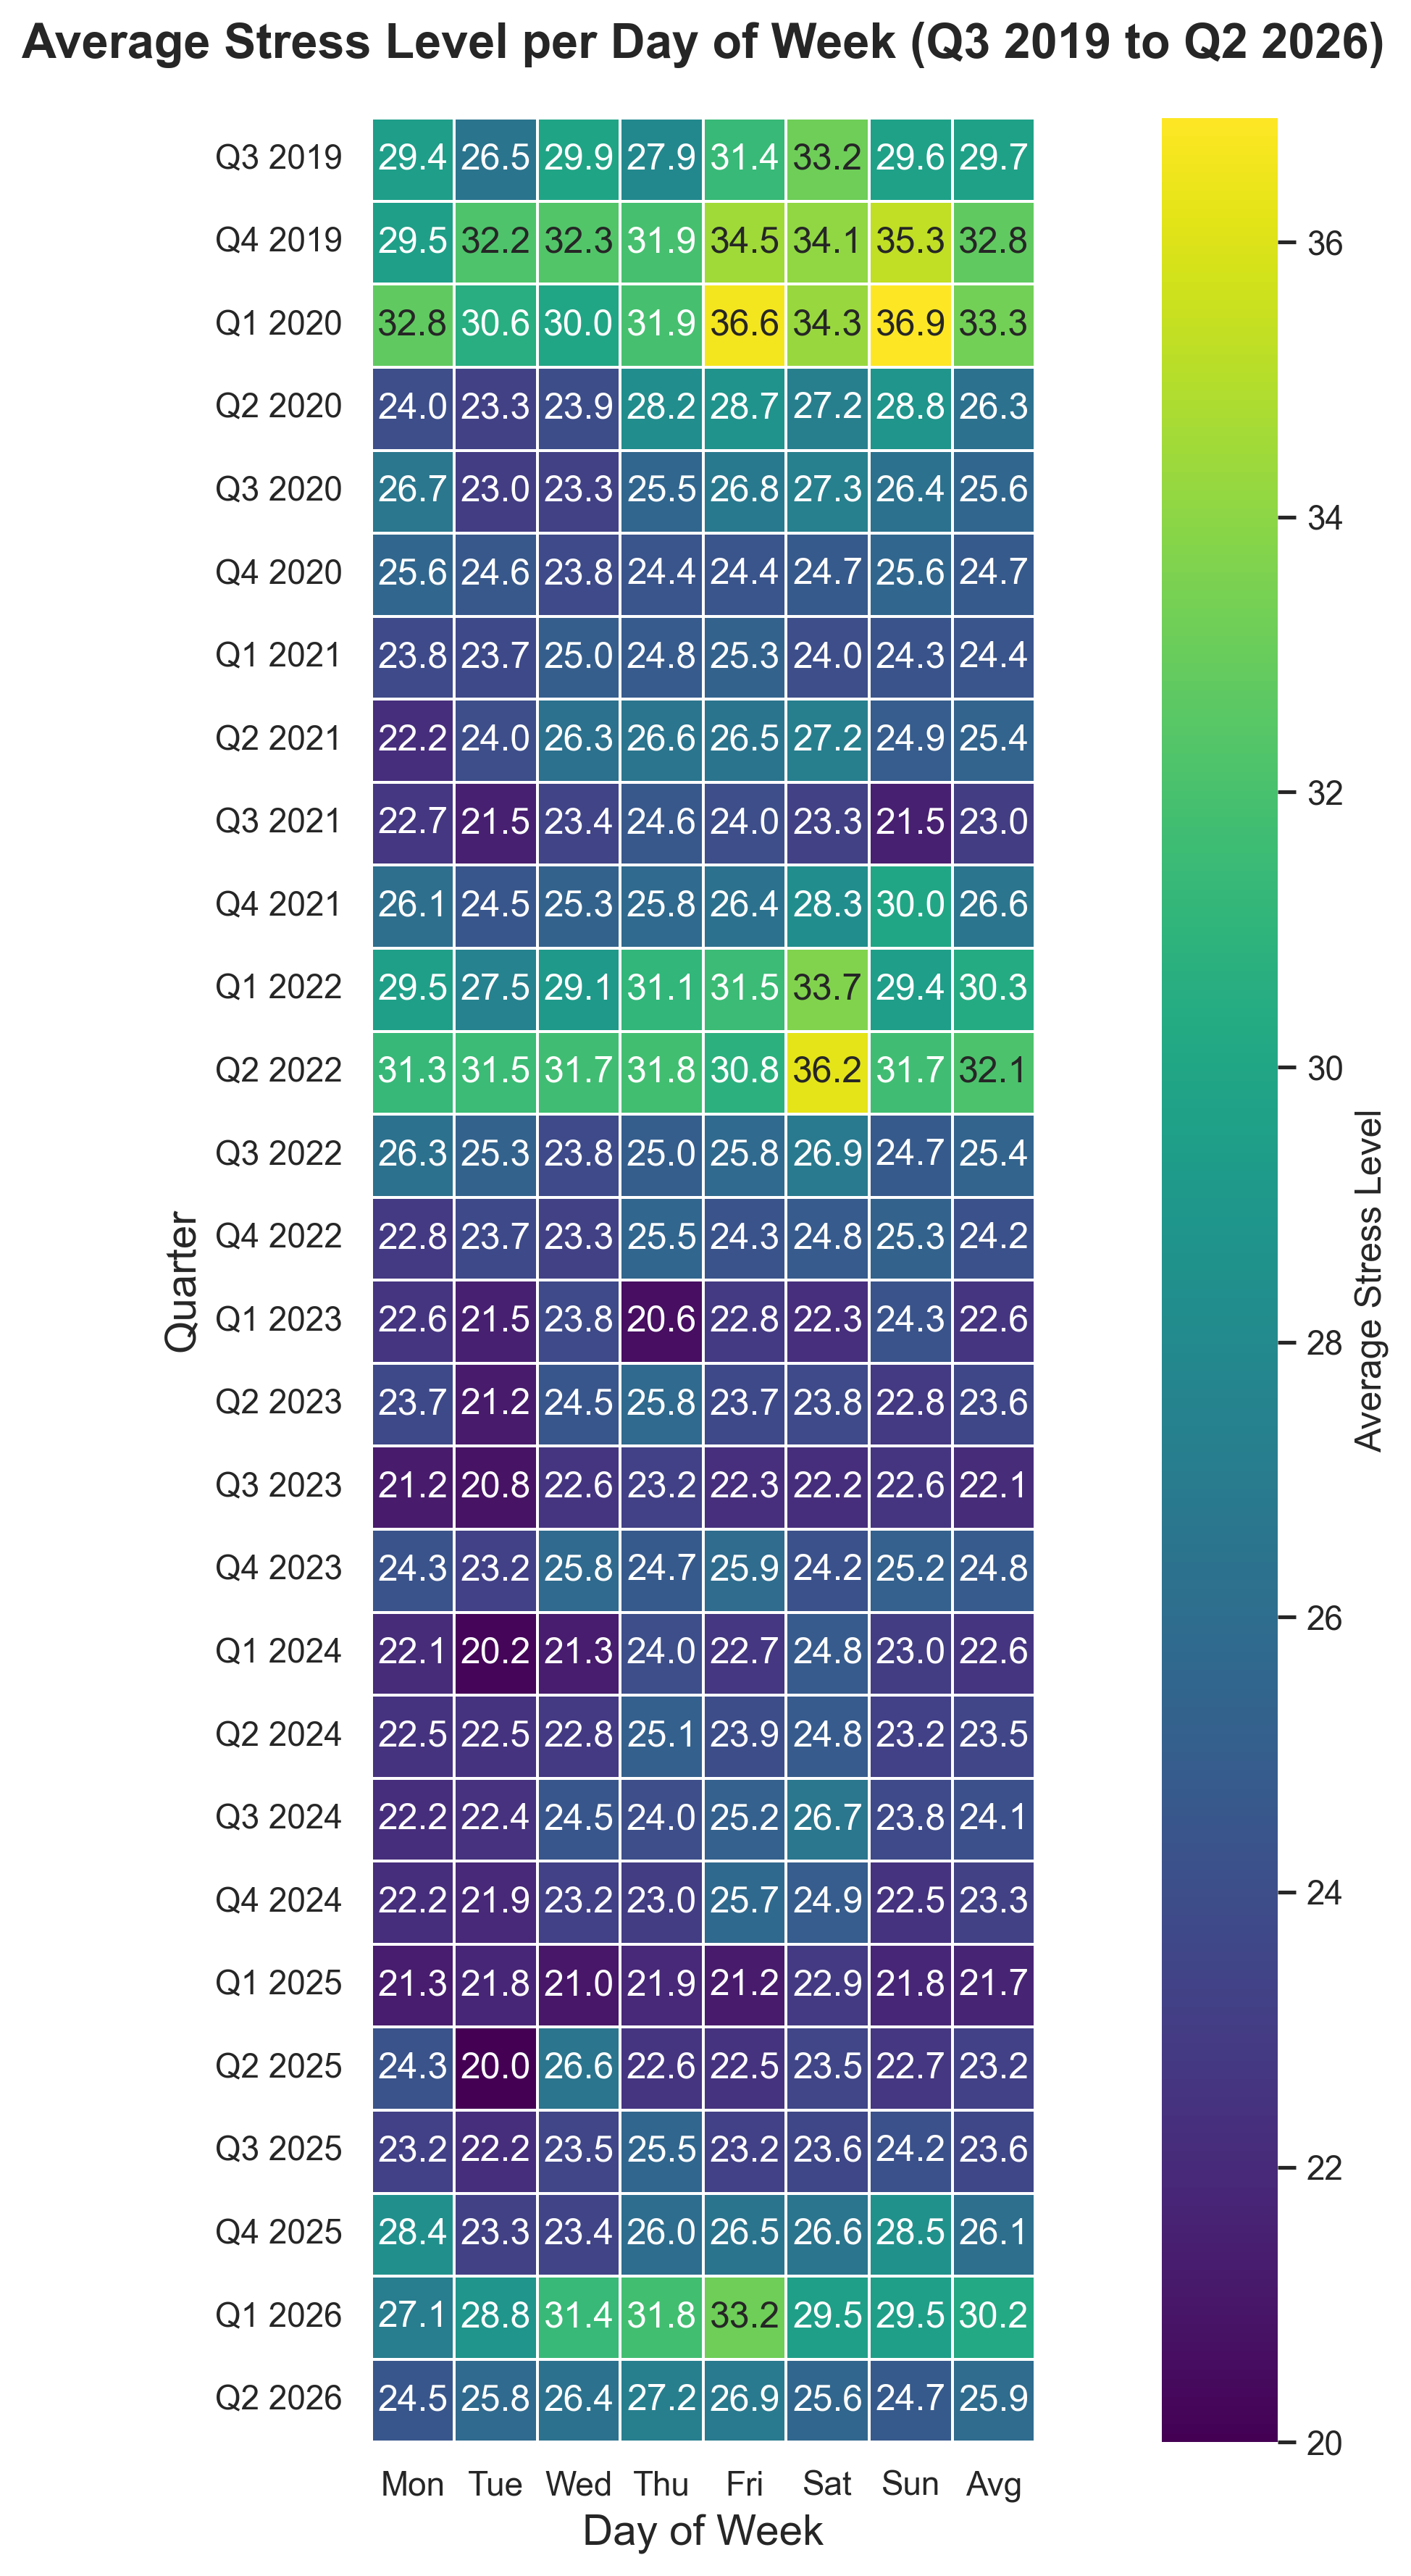
Average stress dropped from 30.2 in Q1 to 25.9 in Q2, across 89 daily-summary records. That is a meaningful move in the right direction.
Weekly stress trend:
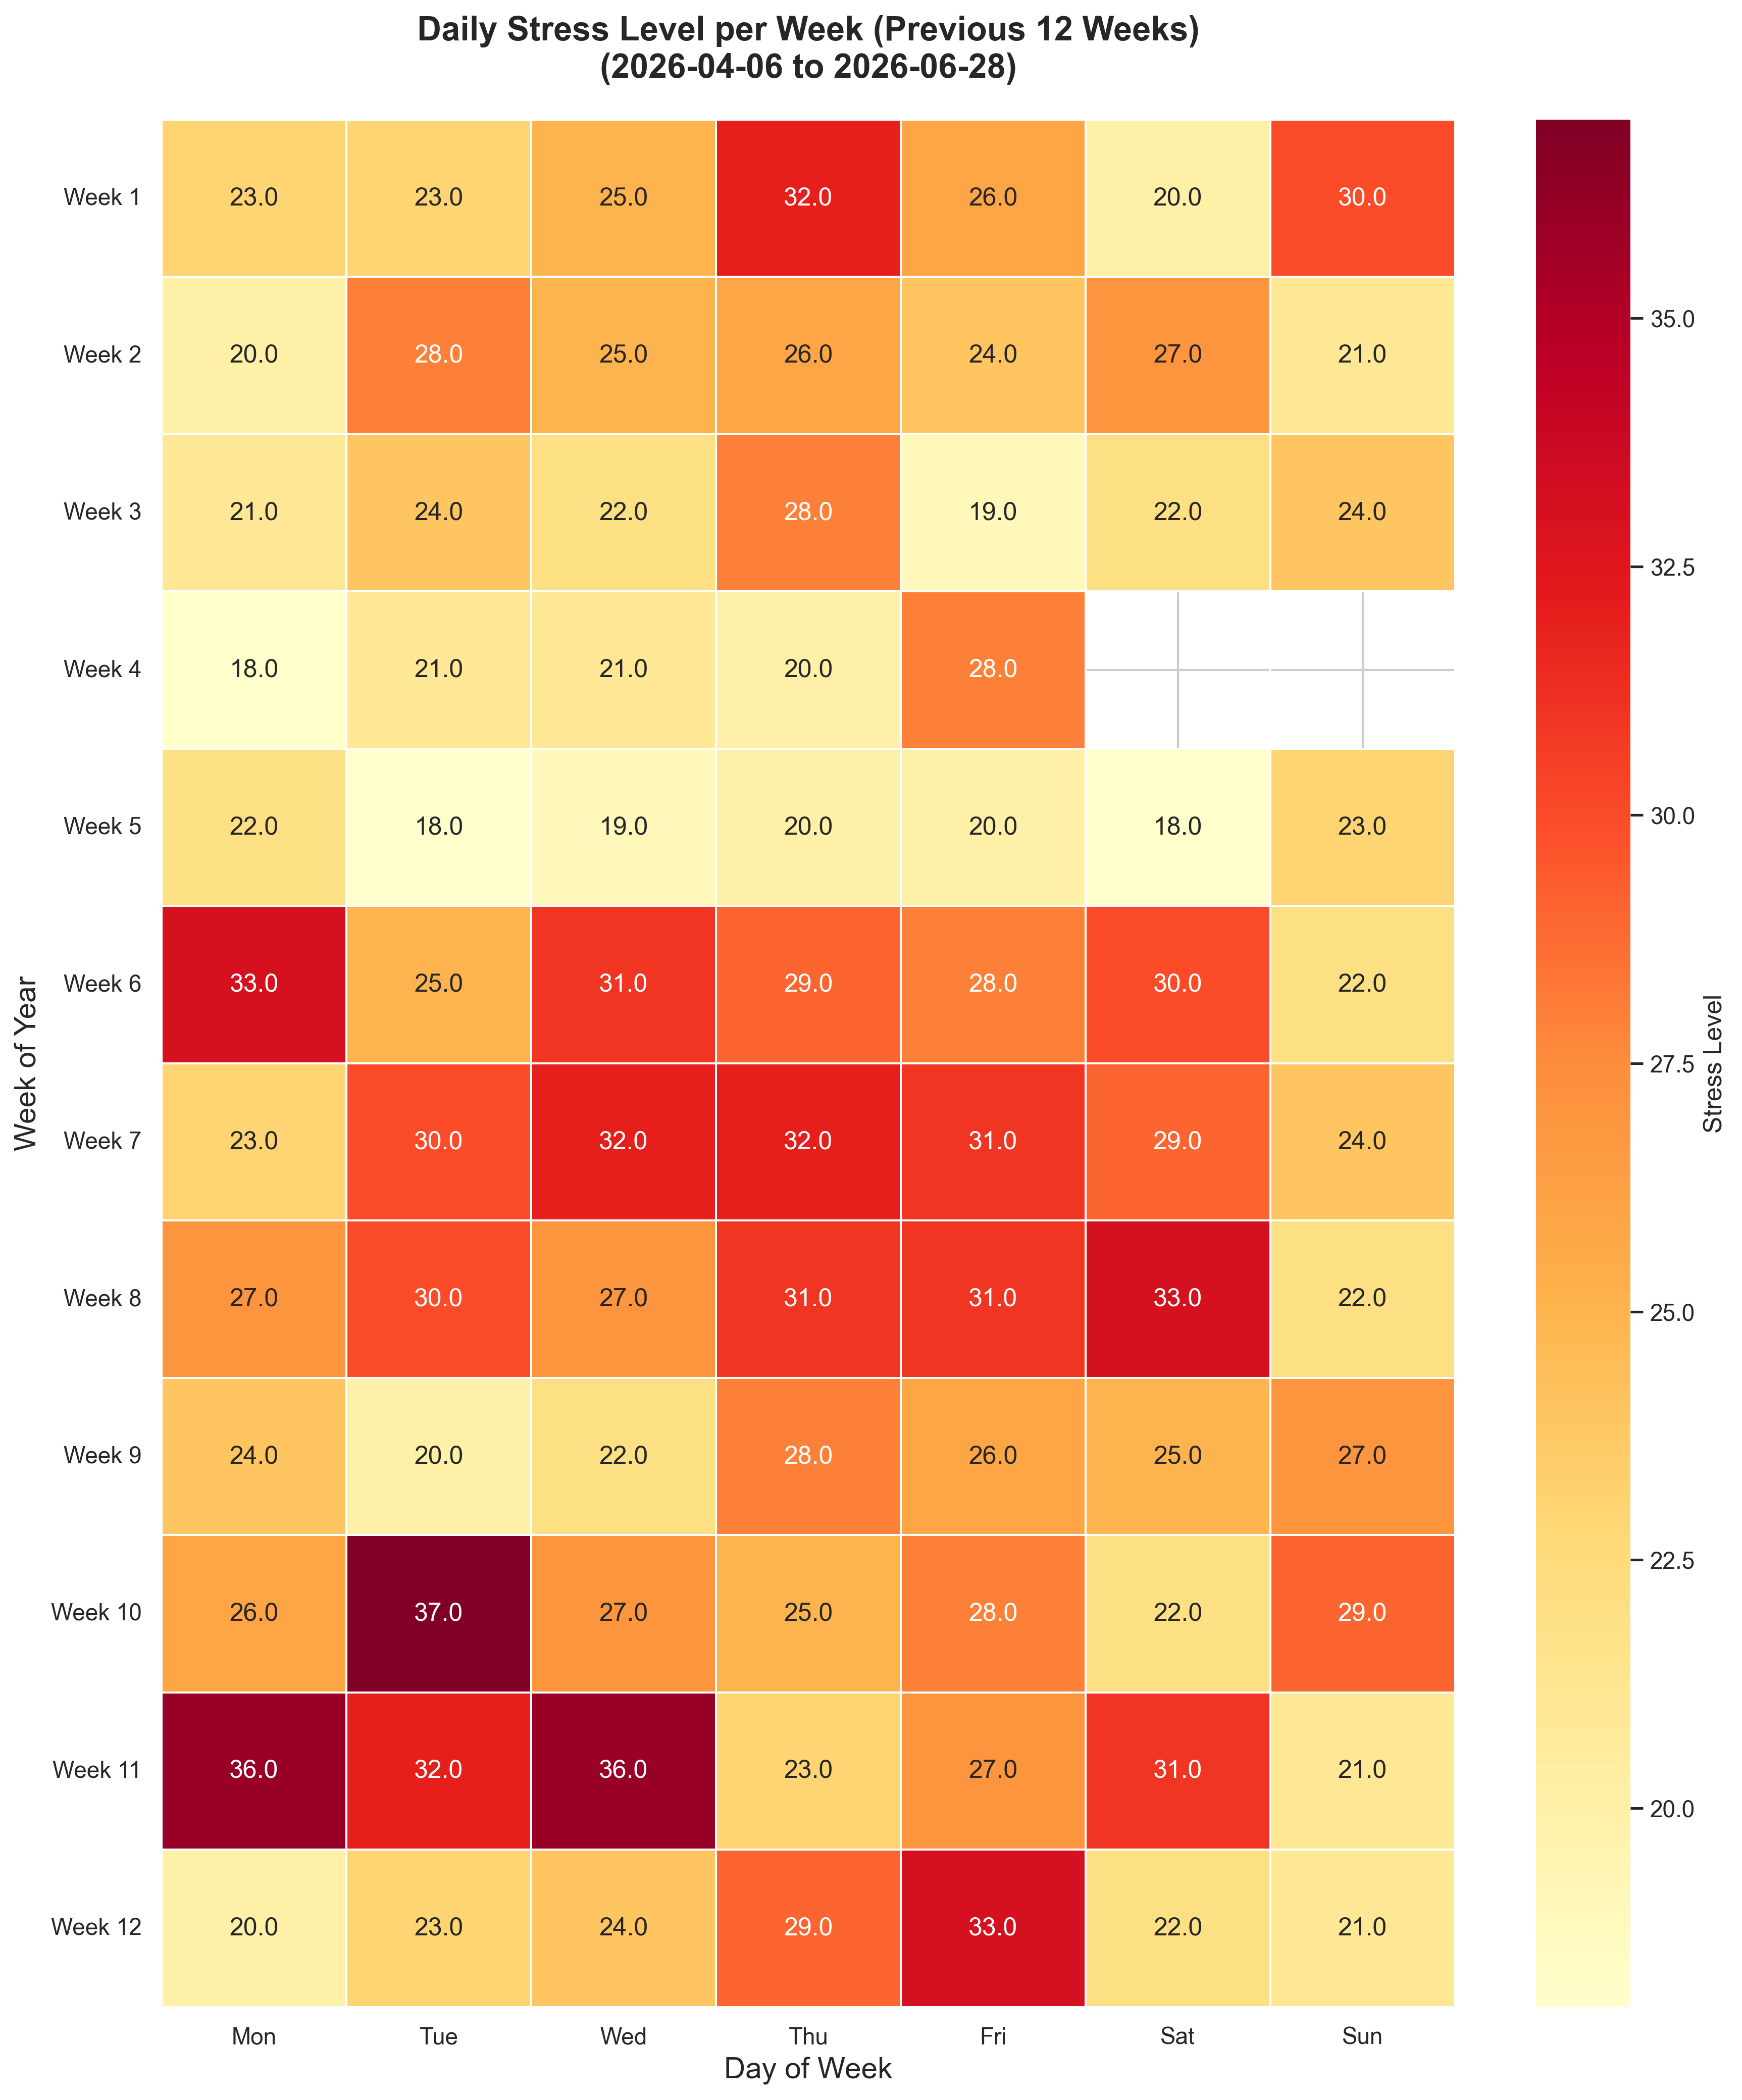
The highest-stress days were Thursday (27.2) and Friday (26.9). Monday was lowest (24.5), with Sunday also relatively low (24.7). So the mid-to-late-week stress pattern is still there, but the whole baseline looks lower than Q1.
Experiments
I do not want to over-explain the cause from Garmin data alone. The measured result is clear: stress came down and recovery improved. The useful Q3 question is what made April work better, and how to avoid the May dip turning into a default pattern.
Improve Nutrition
Experiments
The main experiment that I ran this quarter was around fasting glucose. While my numbers aren’t terrible, I wanted to try and drive this number down. I decided to re-visit getting a CGM and see which foods spike my levels. The first day was relatively uneventful: wholemeal toast with peanut butter and fig jam was fine, as was my “Nutty Pudding”-inspired smoothie, same with some pasta and vegetables. On day two though I decided to try a new laksa place, which isn’t a type of food I even typically eat that often, and stood back as I could see my fasting glucose levels soar. When I saw them raise I immediately went on a walk, but even that didn’t help.
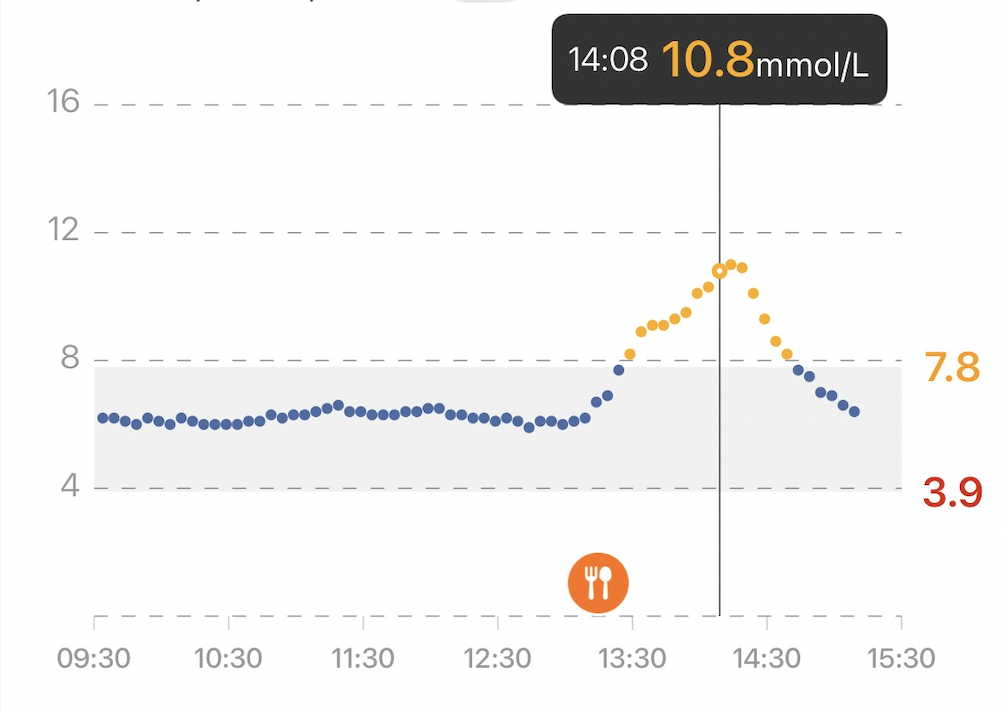
My intuition started to experiment with different foods. Overall here is what my record looked like for the entire duration:
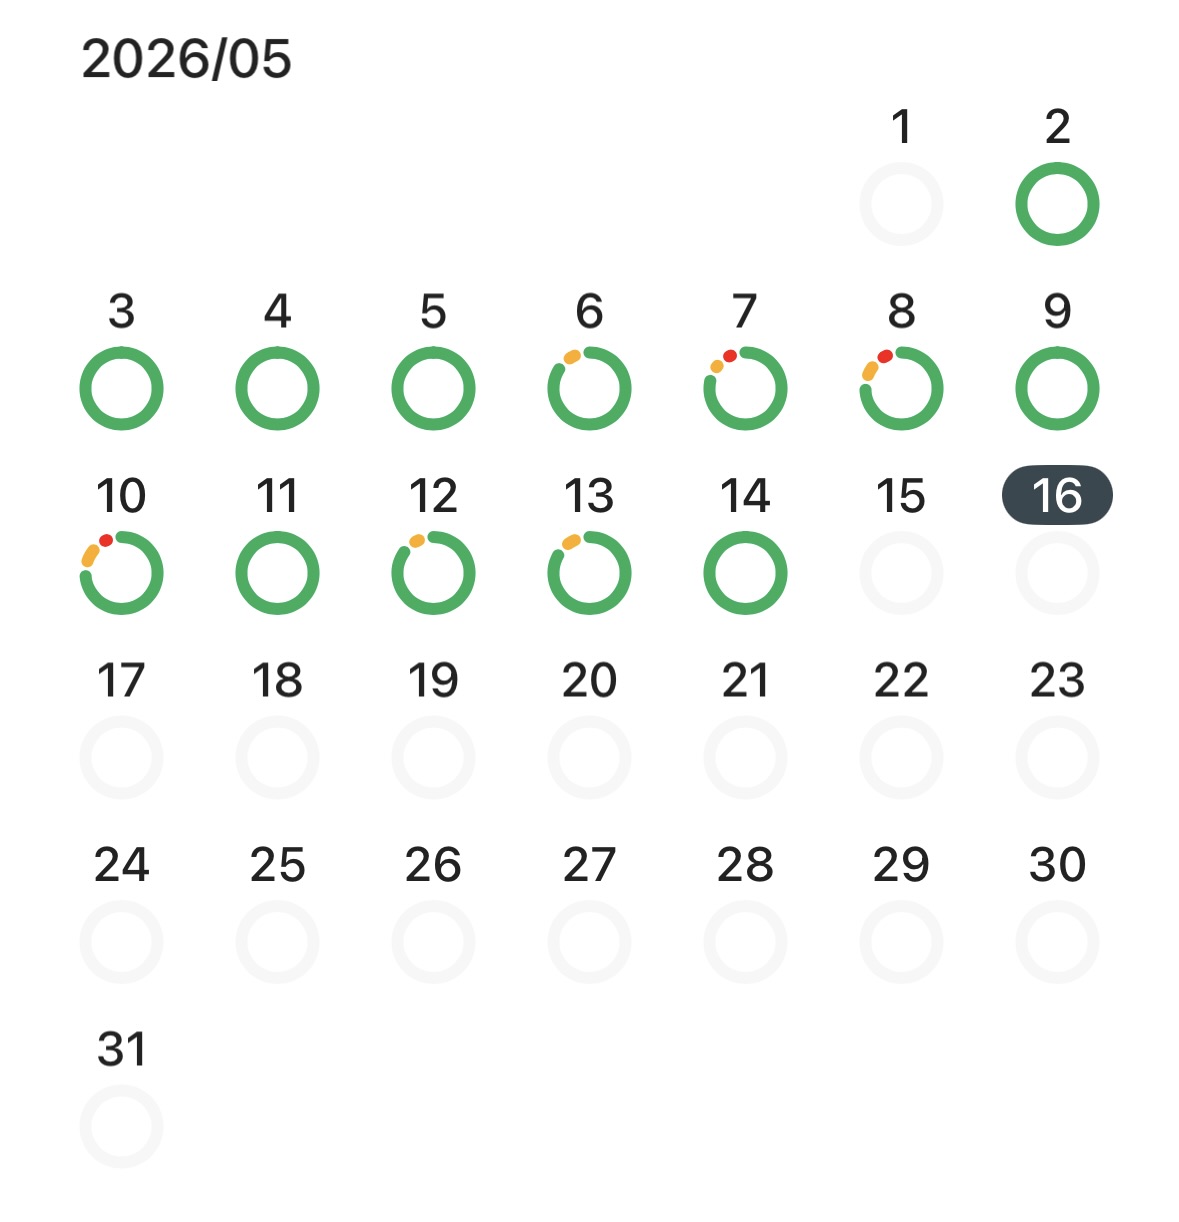
Food that spiked my glucose
- Laksa
- Wonton noodle soup
- GYG burritos
- Airline food
This isn’t to say that I’ll never eat these sorts of meals again, but I’ll aim to time them better around exercise.
Supplement Stack
Some principles that I tried to follow:
- Avoid pill burden; prefer food over pills.
- Wait until a supplement is on the ITP supported interventions page, or has significant evidence behind it.
- Have a biomarker in mind that a certain supplement will change.
Current stack:
| Morning | Evening | Ad Hoc |
|---|---|---|
| Vitamin D (5000 IU) | Glycine (10g) | Iron (20mg) |
| Vitamin K2 mk7 (100mcg) | NAC (1g) | Vitamin C (500mg) |
| B-complex / methylated B vitamins | Magnesium | |
| Zinc (15mg) | ||
| Hyaluronic Acid (200mg) | ||
| Iodine (150mcg) | ||
| Creatine (5g - in smoothie) | ||
| TMG (1.5g - in smoothie) | ||
| Boron (1mg - in smoothie) | ||
| Taurine (3g - in smoothie) | ||
| Omega-3 (1g EPA, 750mg DHA) |
Experiments
- Fish oil remains in the stack for now because sardines were not frequent enough to make food-only omega-3 intake reliable.
- Dropping tart cherry and melatonin still looks reasonable unless the Q3 sleep data clearly worsens.
Focus For Next Quarter
Based on the completed Q2 data, key priorities for Q3 2026 are:
General
- Keep pressure on building back healthy habits after a rough Q1.
- Bring average sleep score back above 80 consistently.
- Treat May as the cautionary month: lower sleep, lower body battery, and lower activity are all visible there. Don’t get dismayed and focus on what you can control.
Exercise
- Rebuild weekly training volume toward the 800-minute target.
- Get VO2Max back to above 50.
- Increase strength training substantially
Nutrition
- Leverage the CGM feedback to identify meals that produce outsized spikes. Consider bringing Metamucil and consume before high-risk meals.
- Treat high-spike restaurant meals as experiments rather than defaults.
Wish me luck!