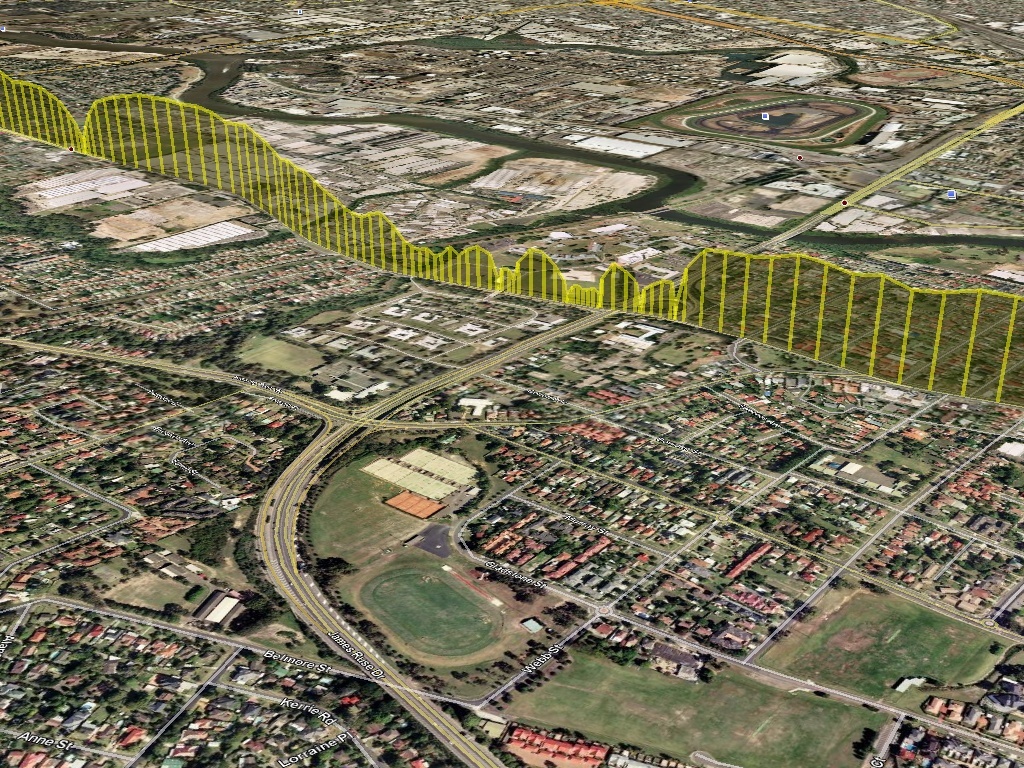
Baby Steps at Graphing Traffic
Status: ✅
You can likely tell that I’ve been having some fun with graphing and mapping recently. I was reading a few articles about GIS and stumbled upon a pretty darn cool project at Webopticon, which included cool pictures. I showed it to a friend thinking they would find it interesting, and then realized: oh! KML has an altitude attribute. That could be interesting.
One of my projects is to create maps of Sydney’s traffic, so I have been experimenting heavily with Mapnik and OSM. I figured I could have some fun and finally parse some gps tracks and display the data.
I first started off trying to play around with the KML files my gps logger natively stores. After a while I realized it shouldn’t be this hard to parse the XML, and realized it also stores data in gpx format. I opened up one of the gpx files and immediately saw how much easier it would be to work with. I quickly created a parser for the xml in Python (using the dom method, yet I think I’m going to rewrite it using sax), and then with the aid of an article by Sean Gillies, converted the needed objects into KML. I used the speed attribute (with some magnification) as the altitude, and voila, a pretty picture.
This picture is as Victoria Road crosses James Rouse Drive – a spot that is always congested in the morning.
I’ll likely post some code shortly, I would like to rewrite the parsing section to use something event-driven – hopefully it will be a little faster.